HOT TOPICS LIST
- MACD
- Fibonacci
- RSI
- Gann
- ADXR
- Stochastics
- Volume
- Triangles
- Futures
- Cycles
- Volatility
- ZIGZAG
- MESA
- Retracement
- Aroon
INDICATORS LIST
LIST OF TOPICS
PRINT THIS ARTICLE
by Donald W. Pendergast, Jr.
After a parabolic rise, the gold/crude oil ratio appears to be moderating.
Position: Buy
Donald W. Pendergast, Jr.
Donald W. Pendergast is a financial markets consultant who offers specialized services to stock brokers and high net worth individuals who seek a better bottom line for their portfolios.
PRINT THIS ARTICLE
REL. STR COMPARATIVE
Gold/Crude Ratio Reversal
01/06/09 08:29:11 AMby Donald W. Pendergast, Jr.
After a parabolic rise, the gold/crude oil ratio appears to be moderating.
Position: Buy
| Until early last week (the final days of 2008), it appeared that gold was outperforming crude oil by a wide margin; gold had recovered nicely from its most recent test of the $700 zone even as crude oil struggled to find a solid floor after months of relentless declines. Now, however, crude has begun a short-covering rally that has caused a major trend reversal in the ratio between these two inflation-sensitive commodities. Let's look at the weekly gold/crude oil ratio chart. |

|
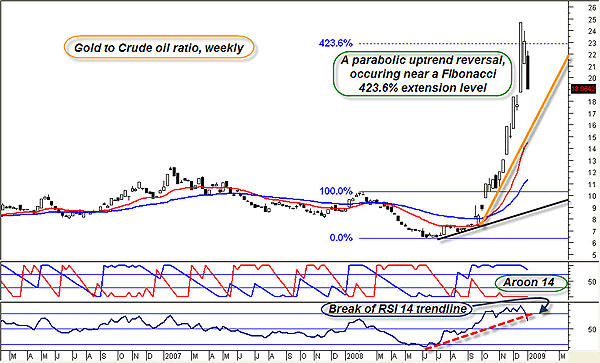
| FIGURE 1: GOLD TO CRUDE OIL RATIO, WEEKLY. Here's a trend reversal after a parabolic rise. A 38% retracement would bring the ratio back into the mid-17s, right near the golden up trendline. |
| Graphic provided by: MetaStock. |
| |
| The weekly ratio chart (Figure 1) clearly depicts the major trend reversal under way, one that signifies an anticipated period of stronger crude oil prices relative to gold. Based on Fibonacci retracement calculations, a 38% pullback in the ratio would bring it close to 17.60, not far from the golden up trendline. Note how the parabolic move failed to gain much ground once the 423% Fib extension level was reached; using extension levels in conjunction with other divergence-measuring tools can be a great way to forecast likely turning points in a given market. Two other indicators are also flashing warning signs — the relative strength index (RSI)(14) has broken its long-term up trendline, and the Aroon 14, although still squarely in bullish mode, is also exhibiting some weakness. While gold still has the stronger long-term trend, it would not be surprising to see crude oil retrace 23–38% (both Fibonacci ratios) of its devastating decline from $147 to $32. Such retracement moves could take crude oil back toward the $58–76 range, and in relatively short order. Futures traders may wish to construct spread trades that favor crude oil over gold for as long as the reversal in the ratio holds. Viewing the individual components of the gold/crude oil ratio chart may provide us with a better view of the dynamics that are driving each of these markets. |

|
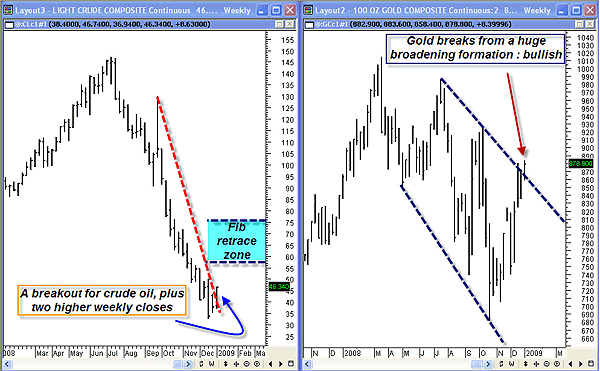
| FIGURE 2: CONTRAST. Two radically different chart patterns, each with bullish implications for the near term. |
| Graphic provided by: MetaStock. |
| |
| A contrast not readily visible on the ratio chart itself! Crude oil (Figure 2, left chart) has completed two consecutive higher weekly closes even as it has broken above a fairly significant down trendline. Logically, a round of short-covering is the cause for the reversal; whether prices can soon attain to the blue Fibonacci 23–38% retracement zone is still unknown. Given that option volatility remains extremely high, enterprising traders may wish to consider the possibility of selling near-term, out-of-the-money puts on crude oil in anticipation of a move up toward that 23% Fibonacci retracement near $58. Gold, meanwhile (Figure 2, right chart), has completed a weekly close outside of an enormous broadening formation; it's a bullish setup, but, as with all major chart patterns, it's subject to any number of fakeout and shakeout moves. Traders wishing to play this pattern in the weekly gold chart would be better advised to time entries on the daily gold chart. For the moment, both gold and crude are in bullish mode, and both are demonstrating a potential to move higher in the coming weeks. |
| Crude oil is regaining strength and gold remains strong — so what? What if you're not playing the gold/oil spread with futures contracts — what then? How can the average equity trader benefit from using a ratio chart like this, anyway? Well, the odds of success are higher if a trader goes long the strongest stocks in the strongest industry groups (and vice versa, shorting the weakest stocks in the weakest industry groups). Gold and silver stocks are near the top of the relative strength (RS) list versus the Standard & Poor's 500, so a wise trader would attempt to locate low-risk long entry points in the component stocks in the gold/silver industry group. There are some outperformers in the oil and gas and oil services industry groups, but none are as strong as those in the precious metals equity complex. The strongest relative strength names in the PM (precious metals) stock group are Silver Standard Resources, Kinross Gold, and Newmont Mining. Buying pullbacks against the trend on the daily and 60-minute charts may be the best route for swing traders following these particular PM equities. Trading in the direction of strong industry group relative strength makes it much easier (and less stressful) to time your entries into your favorite stocks. |
| Ratio charts are essential for spread traders, but they're also of great value to equity traders who like to capitalize on differences in relative strength. Strong industry group strength tends to persist, giving an added measure of confidence to trades placed in-sync with such powerful trending moves. |
Donald W. Pendergast is a financial markets consultant who offers specialized services to stock brokers and high net worth individuals who seek a better bottom line for their portfolios.
| Title: | Writer, market consultant |
| Company: | Linear Trading Systems LLC |
| Jacksonville, FL 32217 | |
| Phone # for sales: | 904-239-9564 |
| E-mail address: | lineartradingsys@gmail.com |
Traders' Resource Links | |
| Linear Trading Systems LLC has not added any product or service information to TRADERS' RESOURCE. | |
Click here for more information about our publications!
Comments
Date: 01/07/09Rank: 4Comment:
Date: 01/07/09Rank: 4Comment:

Request Information From Our Sponsors
- StockCharts.com, Inc.
- Candle Patterns
- Candlestick Charting Explained
- Intermarket Technical Analysis
- John Murphy on Chart Analysis
- John Murphy's Chart Pattern Recognition
- John Murphy's Market Message
- MurphyExplainsMarketAnalysis-Intermarket Analysis
- MurphyExplainsMarketAnalysis-Visual Analysis
- StockCharts.com
- Technical Analysis of the Financial Markets
- The Visual Investor
- VectorVest, Inc.
- Executive Premier Workshop
- One-Day Options Course
- OptionsPro
- Retirement Income Workshop
- Sure-Fire Trading Systems (VectorVest, Inc.)
- Trading as a Business Workshop
- VectorVest 7 EOD
- VectorVest 7 RealTime/IntraDay
- VectorVest AutoTester
- VectorVest Educational Services
- VectorVest OnLine
- VectorVest Options Analyzer
- VectorVest ProGraphics v6.0
- VectorVest ProTrader 7
- VectorVest RealTime Derby Tool
- VectorVest Simulator
- VectorVest Variator
- VectorVest Watchdog
