HOT TOPICS LIST
- MACD
- Fibonacci
- RSI
- Gann
- ADXR
- Stochastics
- Volume
- Triangles
- Futures
- Cycles
- Volatility
- ZIGZAG
- MESA
- Retracement
- Aroon
INDICATORS LIST
LIST OF TOPICS
PRINT THIS ARTICLE
by James Kupfer
Airlines moved up in the last few months. Are they breaking out to the upside, or is this time to sell?
Position: Buy
James Kupfer
Mr. Kupfer is a market professional and amateur stock market commentator. Disclosure: It is likely that Mr. Kupfer has or will enter a position in any security he writes about.
PRINT THIS ARTICLE
SYMMETRICAL TRIANGLE
Airline Breakout?
01/05/09 11:10:30 AMby James Kupfer
Airlines moved up in the last few months. Are they breaking out to the upside, or is this time to sell?
Position: Buy
| Over the last few weeks, I've written about positive chart patterns developing in JetBlue and Alaska Airlines. The positive developments occurring in those stocks seem to be supported by the airline sector in general now with the potential breakout of the airline index from a symmetrical triangle. |
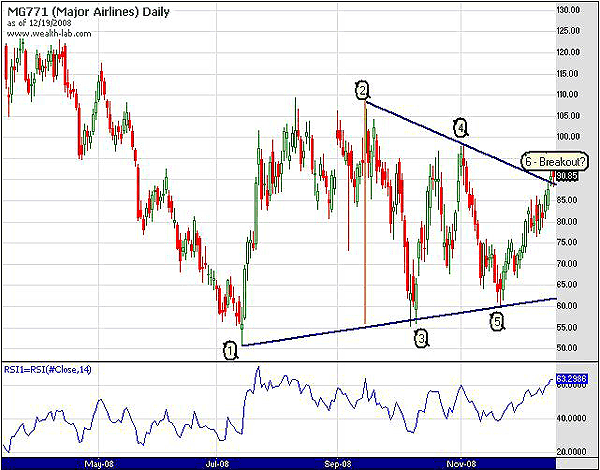
| As can be seen in Figure 1, the Major Airlines Index has been caught between ascending and descending trendlines since July 2008. The bottom trendline has formed three points while the top one formed two prior to last week's potential breakout. |

|
| FIGURE 1: MAJOR AIRLINES INDEX, DAILY. The relative strength index (RSI) is moving up strongly in support of this potential price breakout. |
| Graphic provided by: Wealth-lab. |
| |
| Assuming this breakout holds, which seems likely, the price target can be calculated by finding the difference between point 2 at $108.58 and the value at the lower trendline below point 2, which in this case is $56. Adding that difference to the breakout price of $90 leads to a price target of $142.58. |
Mr. Kupfer is a market professional and amateur stock market commentator. Disclosure: It is likely that Mr. Kupfer has or will enter a position in any security he writes about.
Click here for more information about our publications!
Comments
Date: 01/06/09Rank: 4Comment:

Request Information From Our Sponsors
- StockCharts.com, Inc.
- Candle Patterns
- Candlestick Charting Explained
- Intermarket Technical Analysis
- John Murphy on Chart Analysis
- John Murphy's Chart Pattern Recognition
- John Murphy's Market Message
- MurphyExplainsMarketAnalysis-Intermarket Analysis
- MurphyExplainsMarketAnalysis-Visual Analysis
- StockCharts.com
- Technical Analysis of the Financial Markets
- The Visual Investor
- VectorVest, Inc.
- Executive Premier Workshop
- One-Day Options Course
- OptionsPro
- Retirement Income Workshop
- Sure-Fire Trading Systems (VectorVest, Inc.)
- Trading as a Business Workshop
- VectorVest 7 EOD
- VectorVest 7 RealTime/IntraDay
- VectorVest AutoTester
- VectorVest Educational Services
- VectorVest OnLine
- VectorVest Options Analyzer
- VectorVest ProGraphics v6.0
- VectorVest ProTrader 7
- VectorVest RealTime Derby Tool
- VectorVest Simulator
- VectorVest Variator
- VectorVest Watchdog
