HOT TOPICS LIST
- MACD
- Fibonacci
- RSI
- Gann
- ADXR
- Stochastics
- Volume
- Triangles
- Futures
- Cycles
- Volatility
- ZIGZAG
- MESA
- Retracement
- Aroon
INDICATORS LIST
LIST OF TOPICS
PRINT THIS ARTICLE
by Donald W. Pendergast, Jr.
The energy sector is still struggling to find a solid base to build upon after falling for the better part of five months. Here's a setup on an ultra-high yield stock in the oil & gas pipeline industry group.
Position: Buy
Donald W. Pendergast, Jr.
Donald W. Pendergast is a financial markets consultant who offers specialized services to stock brokers and high net worth individuals who seek a better bottom line for their portfolios.
PRINT THIS ARTICLE
DIVIDEND YIELD
A High-Yield Dividend Play For Energy Bulls
12/23/08 01:41:14 PMby Donald W. Pendergast, Jr.
The energy sector is still struggling to find a solid base to build upon after falling for the better part of five months. Here's a setup on an ultra-high yield stock in the oil & gas pipeline industry group.
Position: Buy
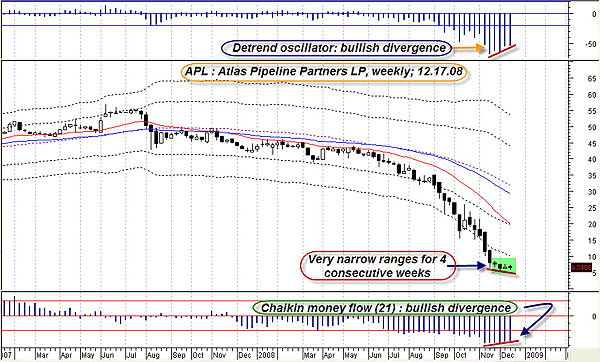
| Atlas Pipeline Partners LP (APL) is a firm engaged in the gathering, processing, and transmission of natural gas within the US. The company has paid a steadily rising dividend since March 2000 and until the summer of 2007, the stock had generally been on the rise despite a few occasional setbacks. Since July 2007, however, APL is off by a whopping 87%, a situation that has had an unexpected side benefit: the stock currently boasts a dividend yield of 60.70%. That's not a misprint, and for longer-term energy bulls who believe the worst of the selling is over, APL offers a unique, fairly low-risk income opportunity. The weekly chart is a good place to begin with this stock. See Figure 1. |

|
| FIGURE 1: APL, WEEKLY. A sudden shrinkage in ranges over the past four weeks, combined with bullish price-momentum divergences. |
| Graphic provided by: MetaStock. |
| Graphic provided by: WB EOD Detrend from ProfitTrader for MetaStock. |
| |
| At first glance, it looks pretty grim; price is outside the extreme lower Keltner band, an occurrence that is typical of stocks in various states of freefall. Even the spread between the exponential moving averages (EMAs) is expanding, signifying the presence of extremely strong downside momentum. Obviously, APL is not necessarily a stock poised for a strong rebound at the moment, but if we look a bit closer we can see some legitimately bullish technical happenings on this weekly chart (Figure 1). First off, the detrend oscillator (top window) is manifesting an extremely bullish price-momentum divergence. Second, the Chaikin money flow (21) indicator (lower window) is also showing signs of bullish divergence. Finally, look at how narrow the ranges of the last four weekly candles have been; it appears as if much of the fear has been or is currently being washed out of this market as the smart money begins the process of accumulating shares. While no one can call an exact top or bottom in any market, APL does appear to be approaching some sort of a lower-volatility support phase, one that we can get a better idea of as we drill down to this stock's daily chart (Figure 2). |

|
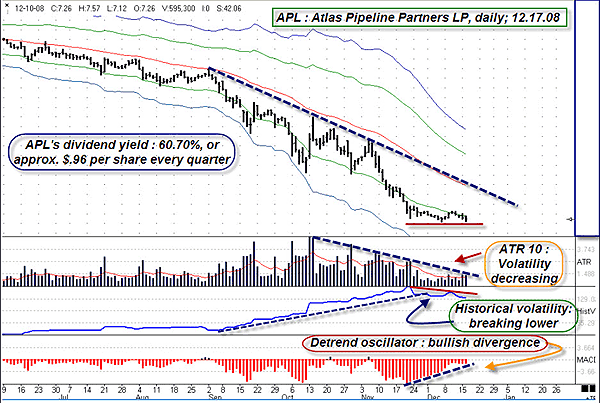
| FIGURE 2: APL, DAILY. Rapidly falling daily volatility, bullish divergence, an outsized dividend payout, and a tentative low in the making all help to create a potentially appealing image for value-oriented traders. |
| Graphic provided by: Ensign Windows. |
| |
| Atlas Pipeline's daily graph is even more telling; here, we can see that APL is attempting to hammer out a significant low on greatly reduced volatility. The average true range (ATR 10) indicator clearly displays the steady erosion of daily volatility over the past two months even as the historical volatility has begun to break down through a major up trendline. Most bullish is the detrend oscillator, which is painting a powerful image of the shift in price momentum. The level of fear and panic in this market is washing out at a major rate of speed as value-oriented investors take note of what they may perceive to be an undervalued, ultra-dividend play. Assuming that a longer-term energy bull believes that APL is at or near a major low and is due for a rebound in the next few weeks/months, how might he go about creating a multiple stream of income arrangement from this stock? |
| Right now, APL's options implied volatility (IV) is still very high; in fact, it's currently higher than 96% of all prior IV readings in this stock during last 400-plus days. So, selling options makes sense in this income/capital gains oriented trade setup. Buy 100 shares (or multiples thereof) of APL and then sell a May 2009 $7.50 call option for approximately $0.75–0.85. If held until May 2009 expiration (145 days), the stock will pay out two dividends of about $0.96/share, or $192, one in February and the other in May. If the trader gets $80 for each call sold, that equals $272 in dividends and option gains during the lifespan of the call option. If APL is called away at $7.50, that would add another $125 in capital gains, giving a maximum potential profit on the trade of approximately $397 on an initial cash layout of $545 — in only five months. If APL shares fail to hit $7.50 or above at expiration, the trader keeps the shares (the option premiums and the dividend payouts are his, regardless) and can choose to write another call option against his APL shares. |
| What if APL keeps falling after you sell the call — what then? If you only buy 100 shares, your risk is essentially capped at $625 (100 shares * 6.25) (APL estimated share price) less $80 in options premiums received, or about $545. Meanwhile, unless the stock goes bust and/or cuts its payout ratio, you'd still be earning almost $100 per quarter for every 100 shares owned. Unless APL is destined to go out of business, be de-listed at some point, or some other extreme event occurs, it would seem that this "sell a call and collect a dividend" trade setup is about as low-risk as they come, but only for traders with sufficient trading capital who are willing to risk 1–2% of their account equity on this play. |
Donald W. Pendergast is a financial markets consultant who offers specialized services to stock brokers and high net worth individuals who seek a better bottom line for their portfolios.
| Title: | Writer, market consultant |
| Company: | Linear Trading Systems LLC |
| Jacksonville, FL 32217 | |
| Phone # for sales: | 904-239-9564 |
| E-mail address: | lineartradingsys@gmail.com |
Traders' Resource Links | |
| Linear Trading Systems LLC has not added any product or service information to TRADERS' RESOURCE. | |
Click here for more information about our publications!
Comments
Date: 12/27/08Rank: 4Comment:
Date: 12/30/08Rank: 5Comment: Very clear and very instructive.

Request Information From Our Sponsors
- StockCharts.com, Inc.
- Candle Patterns
- Candlestick Charting Explained
- Intermarket Technical Analysis
- John Murphy on Chart Analysis
- John Murphy's Chart Pattern Recognition
- John Murphy's Market Message
- MurphyExplainsMarketAnalysis-Intermarket Analysis
- MurphyExplainsMarketAnalysis-Visual Analysis
- StockCharts.com
- Technical Analysis of the Financial Markets
- The Visual Investor
- VectorVest, Inc.
- Executive Premier Workshop
- One-Day Options Course
- OptionsPro
- Retirement Income Workshop
- Sure-Fire Trading Systems (VectorVest, Inc.)
- Trading as a Business Workshop
- VectorVest 7 EOD
- VectorVest 7 RealTime/IntraDay
- VectorVest AutoTester
- VectorVest Educational Services
- VectorVest OnLine
- VectorVest Options Analyzer
- VectorVest ProGraphics v6.0
- VectorVest ProTrader 7
- VectorVest RealTime Derby Tool
- VectorVest Simulator
- VectorVest Variator
- VectorVest Watchdog
