HOT TOPICS LIST
- MACD
- Fibonacci
- RSI
- Gann
- ADXR
- Stochastics
- Volume
- Triangles
- Futures
- Cycles
- Volatility
- ZIGZAG
- MESA
- Retracement
- Aroon
INDICATORS LIST
LIST OF TOPICS
PRINT THIS ARTICLE
by Donald W. Pendergast, Jr.
Now that the highly anticipated reversal of the recent US dollar rally has occurred, how low might it go? Will the mighty yen keep on rising, without any setbacks?
Position: N/A
Donald W. Pendergast, Jr.
Donald W. Pendergast is a financial markets consultant who offers specialized services to stock brokers and high net worth individuals who seek a better bottom line for their portfolios.
PRINT THIS ARTICLE
MOMENTUM
Dollar Dazed, Yen Unfazed -- For Now
12/23/08 12:16:18 PMby Donald W. Pendergast, Jr.
Now that the highly anticipated reversal of the recent US dollar rally has occurred, how low might it go? Will the mighty yen keep on rising, without any setbacks?
Position: N/A
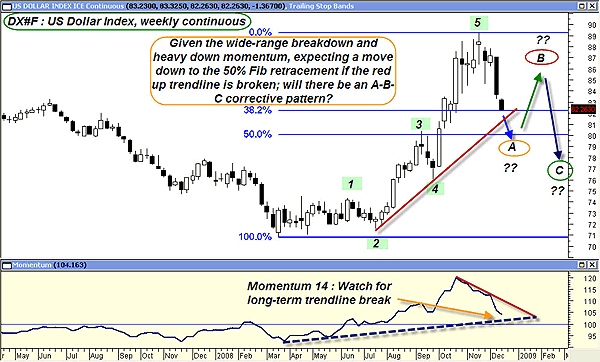
| Down by 7.8% since late November, the US Dollar Index has caught the attention of central bankers, currency traders, and goldbugs worldwide. Gold and silver prices are zooming higher, as are their related mining shares, and all the major foreign currencies are gaining strongly against the once-mighty greenback. Is the current decline nothing more than a simple pullback in a developing uptrend, or is there a higher, more vital market dynamic that is destined to drive the US dollar significantly lower? See Figure 1. |

|
| FIGURE 1: US DOLLAR, INDEX, WEEKLY. Typically, a valid Elliott five-wave motive pattern is followed by an A-B-C corrective wave pattern. |
| Graphic provided by: MetaStock. |
| |
| The dollar index was flying high until November 21, 2008, which was when a visible Elliott five-wave structure completed its very strong motive trend. What every Elliottician had to be asking themselves at that point was something like this: "Is this the start of a higher-degree uptrend, or will the long-term downtrend, first established in 2002, regain control, driving the dollar index to new lows?" Elliott wave analysis sometimes creates more questions than it answers, and the only rational answer then becomes, "I don't know; I must wait for more patterns to unfold." Maybe some of those questions are being answered right now. Last week's big, black wide-range candle shows us that traders are dumping greenbacks with gusto, even as the huge white weekly candles on the euro and Swiss franc (not shown) reveal a near-panic move into these supposed alternatives to the dollar. Right now, the dollar index sits right at the 38.2% Fibonacci retracement, but with the red uptrend line just waiting to be challenged, I don't expect that Fibonacci level to hold. If the red uptrend line breaks, a trip down to the 50% Fibonacci level is the next logical stopping point. Watch the long-term trendline on the momentum (14) indicator; that can also give a clue as to how far this current dollar selloff may go. It's common to see a large A-B-C corrective wave pattern unfold after a well-defined five-wave motive phase, so regardless of how far the dollar falls, the probabilities favor such an occurrence. That doesn't mean it will happen, of course, but it would be unwise to count out such an event from happening. Right now, let's look at a couple of yen charts to see what the world's strongest currency (for the moment) is up to. See Figure 2. |

|
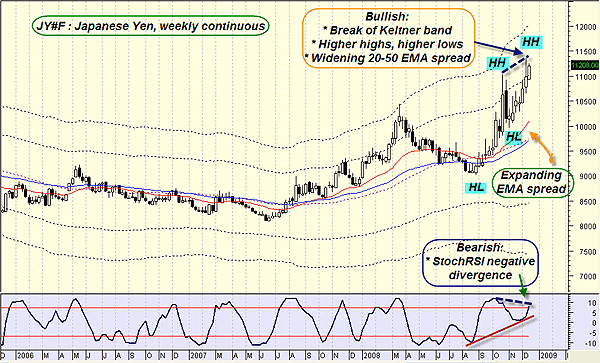
| FIGURE 2: JAPANESE YEN, WEEKLY. A strong uptrend continues, but negative price-momentum divergence may be warning of changes to come. |
| Graphic provided by: MetaStock. |
| |
| The first yen (JY) weekly chart shows the monster, long-term uptrend, complete with higher highs/higher lows, a bullish break above a Keltner band, and a widening spread between the 20- and 50 week exponential moving averages (EMA). However, the bearish price-momentum divergence that has printed on the StochRSI gives an early warning that the trend may run out of steam sooner rather than later. Those who are long the yen may wish to consider booking some partial profits and/or tightening their trailing stops. The following chart gives even more reason for yen bulls to give pause (Figure 3). |

|
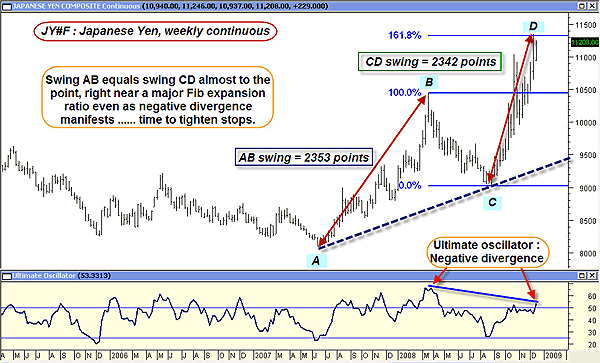
| FIGURE 3: JAPANESE YEN, WEEKLY. A variety of technical measurements are combining to suggest that the yen may be approaching a period of consolidation and/or trend reversal. |
| Graphic provided by: MetaStock. |
| |
| Sometimes, those old trading textbook formulas work out perfectly; the old AB=CD swing ratio formula is showing us that the two major upthrusts in the yen are of almost identical magnitude; swing AB came in at 2,353 points even as swing CD measured 2,342 points. Big deal, you say? The added manifestation of the nearly identical length CD swing hitting a major Fibonacci expansion ratio (161.8%) even as the ultimate oscillator prints a major negative price momentum divergence should be proof positive enough that the yen is at a significant technical juncture. Tightening stops should be job #1 for all those currently long the yen. |
| Two currencies, two unique sets of technicals. For all we know, the yen could keep grinding higher, but for now, the probabilities suggest that the yen's uptrend is signaling that a period of rest and consolidation may be in the cards. As for the dollar index, all longs should already be out of the pool, as that jagged Elliott wave (the A-B-C corrective pattern) may be on the ever-darkening horizon. For these reasons, I rate the US dollar as a "stand aside" and the yen as a wait-and-see. |
Donald W. Pendergast is a financial markets consultant who offers specialized services to stock brokers and high net worth individuals who seek a better bottom line for their portfolios.
| Title: | Writer, market consultant |
| Company: | Linear Trading Systems LLC |
| Jacksonville, FL 32217 | |
| Phone # for sales: | 904-239-9564 |
| E-mail address: | lineartradingsys@gmail.com |
Traders' Resource Links | |
| Linear Trading Systems LLC has not added any product or service information to TRADERS' RESOURCE. | |
Click here for more information about our publications!
Comments
Date: 12/29/08Rank: 3Comment:
Date: 12/30/08Rank: 5Comment:
Date: 12/30/08Rank: 5Comment: It is nice to see the yen at the levels today with the dollar and the euro oscillating around the 140 price over the past days in view of this article - even the low volume (narrow bandwidth) not withstanding.

Request Information From Our Sponsors
- VectorVest, Inc.
- Executive Premier Workshop
- One-Day Options Course
- OptionsPro
- Retirement Income Workshop
- Sure-Fire Trading Systems (VectorVest, Inc.)
- Trading as a Business Workshop
- VectorVest 7 EOD
- VectorVest 7 RealTime/IntraDay
- VectorVest AutoTester
- VectorVest Educational Services
- VectorVest OnLine
- VectorVest Options Analyzer
- VectorVest ProGraphics v6.0
- VectorVest ProTrader 7
- VectorVest RealTime Derby Tool
- VectorVest Simulator
- VectorVest Variator
- VectorVest Watchdog
- StockCharts.com, Inc.
- Candle Patterns
- Candlestick Charting Explained
- Intermarket Technical Analysis
- John Murphy on Chart Analysis
- John Murphy's Chart Pattern Recognition
- John Murphy's Market Message
- MurphyExplainsMarketAnalysis-Intermarket Analysis
- MurphyExplainsMarketAnalysis-Visual Analysis
- StockCharts.com
- Technical Analysis of the Financial Markets
- The Visual Investor
