

HOT TOPICS LIST
- MACD
- Fibonacci
- RSI
- Gann
- ADXR
- Stochastics
- Volume
- Triangles
- Futures
- Cycles
- Volatility
- ZIGZAG
- MESA
- Retracement
- Aroon
INDICATORS LIST
LIST OF TOPICS
PRINT THIS ARTICLE
by David Penn
Is the 30-year bond the most bullish buy around?
Position: N/A
David Penn
Technical Writer for Technical Analysis of STOCKS & COMMODITIES magazine, Working-Money.com, and Traders.com Advantage.
PRINT THIS ARTICLE
HEAD & SHOULDERS
A Bond and its Head and Shoulders Bottom
07/30/01 01:55:56 PMby David Penn
Is the 30-year bond the most bullish buy around?
Position: N/A
| If you're looking for a bull market among stocks, currencies, debt and commodities, one of the most time-tested ways to find them is to search for tradables above their 50-day and 200-day moving averages. One adage testifies that bulls live above the 200-day moving averages and bears live below; that would explain the number of failed upside breakouts in a number of stocks after making 40-day highs: both the S&P 500 and the Nasdaq have been trading beneath their 200-day moving averages since September. While it is possible for tradables to advance significantly when the general market is beneath the 200-day moving average, the fact that the larger market is in bear territory means that the climate is one of selling more than buying. In this atmosphere, even the best breakout may be more susceptible than usual to overwhelming corrections and stop-triggering pullbacks. |
| The 50-day moving average is a better gauge of the intermediate trend, taking into account the most recent month and a half of buying and selling. In addition to determining whether or not price action is represented by higher highs and higher lows or lower highs and lower lows, a 50-day moving average is an excellent way to tell whether a trend is in place, and if so, whether that trend is upward or downward. Used in combination with the 200-day moving average, the 50-day moving average also can help determine when an existing trend may be about to shift or when a new trend is about to begin. |
|
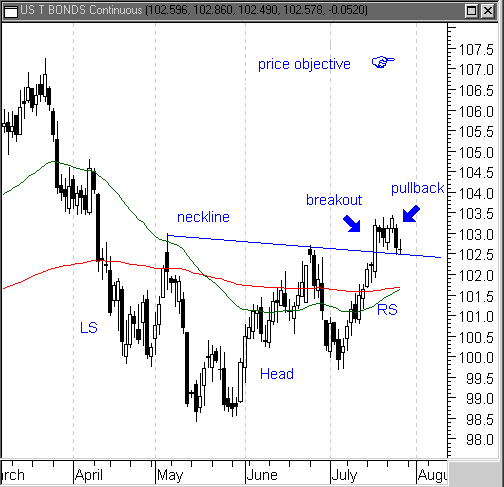
| Figure 1: Between an upside breakout from this intermediate H&S bottom and the swing in moving averages, the 30-year bond could test the March highs. |
| Graphic provided by: MetaStock. |
| |
| It was in looking for tradables above both the 50-day and 200-day averages that brought the 30-year bond to my screen. The 50-day moving average for the 30-year bond (green line) looks to have rounded down and is now moving back up. The 200-day moving average (red line) looks as if it might have started to round over and head back down. However, the intersection of the 50-day moving average (which represents more recent price action) is likely to drive the 200-day average up, turning its rounding over direction upward into more of a sine wave-like pattern. |
| Additionally, the 30-year bond is coming off of a third trough, at 99.7 in late April, 98.4 in mid-May, and 99.7 in early July, and is moving above the area at which all three declines began- approximately 102.5. This price action, which began with a steep drop in early April, is characteristic of an intermediate head and shoulders bottom, in which prices often rally from three successive attempts to establish an intermediate (in this case) bottom. Currently trading at 102.5, the 30-year bond has broken out above the neckline (the area where the declines began) and, should the pattern prove successful, could test the March highs of 107.25. This price objective uses the height from the lowest point in the trough (98.4) to the neckline (102.5) of 4.4, and adds that amount to the value at the neckline, giving an upside target of 106.8. |
| The bullish case for the 30-year bond is further suggested by a breakout above the bond's 40-week moving average (not shown). And it cannot go without saying that the current theme in financial journalism (a recent Wall Street Journal article suggested in part that not bonds alone but diversified bonds were the only prudent way to weather this market) is not exactly discouraging investment in bonds and bond funds. Should the demand for bonds grow--either as a result of recession fears or simply a sobered outlook on stock returns over the near-term--it is hard to believe that the 30-year bond would not benefit. |
Technical Writer for Technical Analysis of STOCKS & COMMODITIES magazine, Working-Money.com, and Traders.com Advantage.
| Title: | Technical Writer |
| Company: | Technical Analysis, Inc. |
| Address: | 4757 California Avenue SW |
| Seattle, WA 98116 | |
| Phone # for sales: | 206 938 0570 |
| Fax: | 206 938 1307 |
| Website: | www.Traders.com |
| E-mail address: | DPenn@traders.com |
Traders' Resource Links | |
| Charting the Stock Market: The Wyckoff Method -- Books | |
| Working-Money.com -- Online Trading Services | |
| Traders.com Advantage -- Online Trading Services | |
| Technical Analysis of Stocks & Commodities -- Publications and Newsletters | |
| Working Money, at Working-Money.com -- Publications and Newsletters | |
| Traders.com Advantage -- Publications and Newsletters | |
| Professional Traders Starter Kit -- Software | |
Click here for more information about our publications!
Comments
Date:�07/31/01Rank:�5Comment:�

Request Information From Our Sponsors
- StockCharts.com, Inc.
- Candle Patterns
- Candlestick Charting Explained
- Intermarket Technical Analysis
- John Murphy on Chart Analysis
- John Murphy's Chart Pattern Recognition
- John Murphy's Market Message
- MurphyExplainsMarketAnalysis-Intermarket Analysis
- MurphyExplainsMarketAnalysis-Visual Analysis
- StockCharts.com
- Technical Analysis of the Financial Markets
- The Visual Investor
- VectorVest, Inc.
- Executive Premier Workshop
- One-Day Options Course
- OptionsPro
- Retirement Income Workshop
- Sure-Fire Trading Systems (VectorVest, Inc.)
- Trading as a Business Workshop
- VectorVest 7 EOD
- VectorVest 7 RealTime/IntraDay
- VectorVest AutoTester
- VectorVest Educational Services
- VectorVest OnLine
- VectorVest Options Analyzer
- VectorVest ProGraphics v6.0
- VectorVest ProTrader 7
- VectorVest RealTime Derby Tool
- VectorVest Simulator
- VectorVest Variator
- VectorVest Watchdog