HOT TOPICS LIST
- MACD
- Fibonacci
- RSI
- Gann
- ADXR
- Stochastics
- Volume
- Triangles
- Futures
- Cycles
- Volatility
- ZIGZAG
- MESA
- Retracement
- Aroon
INDICATORS LIST
LIST OF TOPICS
PRINT THIS ARTICLE
by James Kupfer
The DJ 30 appears to have started a new leg up. How much further might be left?
Position: Accumulate
James Kupfer
Mr. Kupfer is a market professional and amateur stock market commentator. Disclosure: It is likely that Mr. Kupfer has or will enter a position in any security he writes about.
PRINT THIS ARTICLE
FIBONACCI
Is The DJIA Starting A New Leg Up?
12/17/08 08:47:10 AMby James Kupfer
The DJ 30 appears to have started a new leg up. How much further might be left?
Position: Accumulate
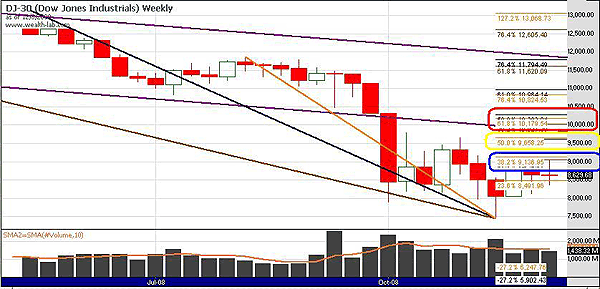
| If we were to assume that the Dow Jones 30 and other major equity indexes have put in a minor bottom, how much upside is left? Fibonacci levels can be helpful to determine potential future price action in the DJIA. To start, find the Fibonacci price levels between the most recent significant low in October and other significant market peaks. I have used the August 2008 (orange), May 2008 (blue), and October 2007 (brown) highs. Due to the convergence of so many price resistance levels, it can be difficult to see them all, so I have circled them on Figure 1. |
| The first level, in blue, is between 9042 and 9136, calculated using a 38% and 23% retracement from the August 2008 and October 2007 highs, respectively. Given that the market has previously come very close to reaching these prices and that the levels are not really all that close together, it seems logical to conclude that 9100 will be passed in the not-too-distant future. |

|
| FIGURE 1: DJIA, WEEKLY. Resistance levels for the DJIA are circled. |
| Graphic provided by: Wealth-lab. |
| |
| The second level, circled in yellow, is formed between 9658 and 9621. It is calculated by finding the 50% and 38.2% retracement levels from August and May highs. In addition, the Dow Jones 30 peaked in October at 9653. This now becomes an additional level of resistance the market must overcome. |
| The final near-term zone of resistance is circled in red between 10000 and 10300. It is formed by a convergence of Fibonacci resistance levels from each of the aforementioned periods. In addition, the bottom of the descending channel formed before the October break is right now at about 10000. |
| Remember, until proven otherwise, traders must operate on the assumption that the bear market is still in effect and that any bounce occurs within the context of the bear. It seems likely that the Dow Jones Industrial Average (DJIA) will surpass the 9100 level, only to stall around 9621–9658. A break above that will take the market to around 10000. Any price action above 9621 may provide a good opportunity to reestablish short positions and sell any longs. |
Mr. Kupfer is a market professional and amateur stock market commentator. Disclosure: It is likely that Mr. Kupfer has or will enter a position in any security he writes about.
Click here for more information about our publications!
Comments
Date: 12/29/08Rank: 4Comment:
Date: 12/30/08Rank: 5Comment: Very clear on the trends and probabilities as indicated by the technicals. I need all these tutorials in order to educate my wooden head.

Request Information From Our Sponsors
- StockCharts.com, Inc.
- Candle Patterns
- Candlestick Charting Explained
- Intermarket Technical Analysis
- John Murphy on Chart Analysis
- John Murphy's Chart Pattern Recognition
- John Murphy's Market Message
- MurphyExplainsMarketAnalysis-Intermarket Analysis
- MurphyExplainsMarketAnalysis-Visual Analysis
- StockCharts.com
- Technical Analysis of the Financial Markets
- The Visual Investor
- VectorVest, Inc.
- Executive Premier Workshop
- One-Day Options Course
- OptionsPro
- Retirement Income Workshop
- Sure-Fire Trading Systems (VectorVest, Inc.)
- Trading as a Business Workshop
- VectorVest 7 EOD
- VectorVest 7 RealTime/IntraDay
- VectorVest AutoTester
- VectorVest Educational Services
- VectorVest OnLine
- VectorVest Options Analyzer
- VectorVest ProGraphics v6.0
- VectorVest ProTrader 7
- VectorVest RealTime Derby Tool
- VectorVest Simulator
- VectorVest Variator
- VectorVest Watchdog
