HOT TOPICS LIST
- MACD
- Fibonacci
- RSI
- Gann
- ADXR
- Stochastics
- Volume
- Triangles
- Futures
- Cycles
- Volatility
- ZIGZAG
- MESA
- Retracement
- Aroon
INDICATORS LIST
LIST OF TOPICS
PRINT THIS ARTICLE
by James Kupfer
After a significant fall in solar energy stocks, is this the time to go long?
Position: Buy
James Kupfer
Mr. Kupfer is a market professional and amateur stock market commentator. Disclosure: It is likely that Mr. Kupfer has or will enter a position in any security he writes about.
PRINT THIS ARTICLE
CONSOLID FORMATION
Solar Energy Update
12/17/08 08:40:46 AMby James Kupfer
After a significant fall in solar energy stocks, is this the time to go long?
Position: Buy
| On November 3, 2008, I suggested shorting shares of TAN, a solar energy exchange traded fund (ETF). Shares peaked the next day at $13.84 and then began a long slide to reach a low of $5.40. This was in line with my price target of "well below $8." So is now the time to cover those shorts and maybe even go long? |

|
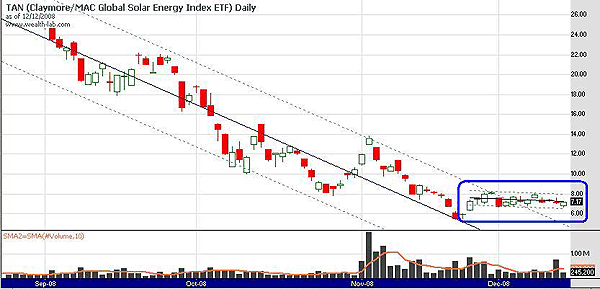
| FIGURE 1: TAN, DAILY. The blue oval shows the stock's new consolidation channel. |
| Graphic provided by: Wealth-lab. |
| |
| TAN has broken out of the old downward sloping trend channel upon which I based my previous comments. It has now set up a small channel consolidation pattern, as can be seen on the daily chart (Figure 1). Along with the consolidation pattern, volume has dried up as well. It is not displayed on the chart, but daily and monthly stochastics are oversold, but weekly stochastics are overbought. |
| In conclusion, given the consolidating channel pattern and the lack of any other discernable evidence to point to a move in either direction, this appears a good time to close out any short positions and to be flat in TAN. |
Mr. Kupfer is a market professional and amateur stock market commentator. Disclosure: It is likely that Mr. Kupfer has or will enter a position in any security he writes about.
Click here for more information about our publications!
Comments
Date: 12/29/08Rank: 4Comment:

Request Information From Our Sponsors
- StockCharts.com, Inc.
- Candle Patterns
- Candlestick Charting Explained
- Intermarket Technical Analysis
- John Murphy on Chart Analysis
- John Murphy's Chart Pattern Recognition
- John Murphy's Market Message
- MurphyExplainsMarketAnalysis-Intermarket Analysis
- MurphyExplainsMarketAnalysis-Visual Analysis
- StockCharts.com
- Technical Analysis of the Financial Markets
- The Visual Investor
- VectorVest, Inc.
- Executive Premier Workshop
- One-Day Options Course
- OptionsPro
- Retirement Income Workshop
- Sure-Fire Trading Systems (VectorVest, Inc.)
- Trading as a Business Workshop
- VectorVest 7 EOD
- VectorVest 7 RealTime/IntraDay
- VectorVest AutoTester
- VectorVest Educational Services
- VectorVest OnLine
- VectorVest Options Analyzer
- VectorVest ProGraphics v6.0
- VectorVest ProTrader 7
- VectorVest RealTime Derby Tool
- VectorVest Simulator
- VectorVest Variator
- VectorVest Watchdog
