HOT TOPICS LIST
- MACD
- Fibonacci
- RSI
- Gann
- ADXR
- Stochastics
- Volume
- Triangles
- Futures
- Cycles
- Volatility
- ZIGZAG
- MESA
- Retracement
- Aroon
INDICATORS LIST
LIST OF TOPICS
PRINT THIS ARTICLE
by James Kupfer
Bonds have had a huge price spike over the last few weeks. Is there more upside left?
Position: Sell
James Kupfer
Mr. Kupfer is a market professional and amateur stock market commentator. Disclosure: It is likely that Mr. Kupfer has or will enter a position in any security he writes about.
PRINT THIS ARTICLE
STOCHASTIC OSCILL
Betting On Bonds
12/16/08 09:53:25 AMby James Kupfer
Bonds have had a huge price spike over the last few weeks. Is there more upside left?
Position: Sell
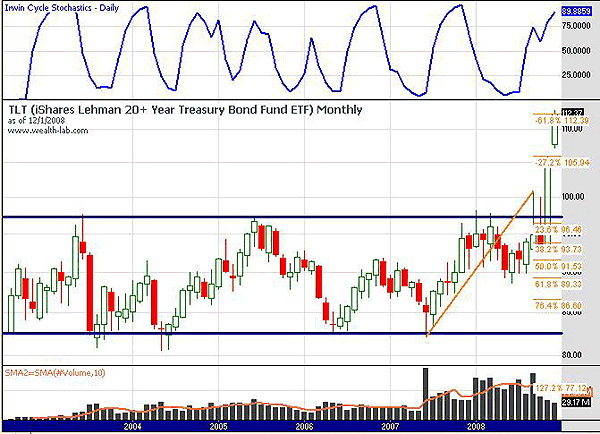
| Shares of TLT, the iShares Lehman 20+ Year Treasury Bond Fund exchange traded fund (ETF), have surged over the last two months. In doing so, they have broken out of the trend channel that extends prior to 2003. Given the massive runup, is there still more upside potential left? |
| Let's look at the evidence. First, looking at the monthly chart (Figure 1), you can see that stochastics are overbought, although they could conceivably move up further. Second, note how the rise in prices over the last seven months has been accompanied by a decrease in volume, especially over the last two months. This is a divergence signal of inherent weakness. |

|
| FIGURE 1: TLT, MONTHLY. This chart shows the old trading range in blue. |
| Graphic provided by: Wealth-lab. |
| |
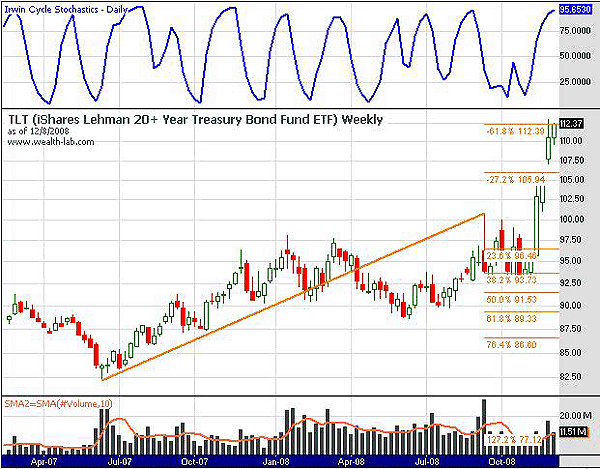
| In addition, a Fibonacci price projection between the bottom of the up move and the most recent pivot high points to prices having reached a significant resistance point. The first resistance level indicated by the price projection was a $105.94. In fact, TLT reached a high of $105.97, just three cents above the Fibonacci level, before gapping up to a new high. The second, and more significant resistance level, is at $112.39. TLT is currently trading just a little north of this price. See Figure 2. |

|
| FIGURE 2: TLT, WEEKLY. This chart shows a closeup of Fibonacci resistance levels. |
| Graphic provided by: Wealth-lab. |
| |
| Taken together, the evidence suggests that a top is very near for TLT. Yes, there is potentially a bit more upside, but probably not enough to justify any purchases at this point. This might even be a good opportunity to sell existing positions or initiate a short position. |
Mr. Kupfer is a market professional and amateur stock market commentator. Disclosure: It is likely that Mr. Kupfer has or will enter a position in any security he writes about.
Click here for more information about our publications!
Comments
Date: 12/17/08Rank: 5Comment:
Date: 12/30/08Rank: 5Comment: This is a good lesson for me... a real dummy. Prices change so rapidly in today s markets that it is difficult to implement these analyses in real-time.

Request Information From Our Sponsors
- StockCharts.com, Inc.
- Candle Patterns
- Candlestick Charting Explained
- Intermarket Technical Analysis
- John Murphy on Chart Analysis
- John Murphy's Chart Pattern Recognition
- John Murphy's Market Message
- MurphyExplainsMarketAnalysis-Intermarket Analysis
- MurphyExplainsMarketAnalysis-Visual Analysis
- StockCharts.com
- Technical Analysis of the Financial Markets
- The Visual Investor
- VectorVest, Inc.
- Executive Premier Workshop
- One-Day Options Course
- OptionsPro
- Retirement Income Workshop
- Sure-Fire Trading Systems (VectorVest, Inc.)
- Trading as a Business Workshop
- VectorVest 7 EOD
- VectorVest 7 RealTime/IntraDay
- VectorVest AutoTester
- VectorVest Educational Services
- VectorVest OnLine
- VectorVest Options Analyzer
- VectorVest ProGraphics v6.0
- VectorVest ProTrader 7
- VectorVest RealTime Derby Tool
- VectorVest Simulator
- VectorVest Variator
- VectorVest Watchdog
