HOT TOPICS LIST
- MACD
- Fibonacci
- RSI
- Gann
- ADXR
- Stochastics
- Volume
- Triangles
- Futures
- Cycles
- Volatility
- ZIGZAG
- MESA
- Retracement
- Aroon
INDICATORS LIST
LIST OF TOPICS
PRINT THIS ARTICLE
by Ron Walker
The VIX, a contrarian indicator, measures the implied volatility of the S&P 500 index options and can be used for spotting turning points in the market. When it peaks, the stock market is near a bottom, and when it puts in a low, the stock market is becoming toppy. With a little detective work, VIX may help us solve the mystery of which direction the market is headed.
Position: N/A
Ron Walker
Ron Walker is an active trader and technical analyst. He operates an educational website dedicated to the study of Technical Analysis. The website offers free market analysis with daily video presentations and written commentaries. Ron is a video pioneer, being one of the first to utilize the internet producing Technical Analysis videos. His website is thechartpatterntrader.com
PRINT THIS ARTICLE
VOLATILITY
VIX In Double Jeopardy
12/16/08 11:27:09 AMby Ron Walker
The VIX, a contrarian indicator, measures the implied volatility of the S&P 500 index options and can be used for spotting turning points in the market. When it peaks, the stock market is near a bottom, and when it puts in a low, the stock market is becoming toppy. With a little detective work, VIX may help us solve the mystery of which direction the market is headed.
Position: N/A
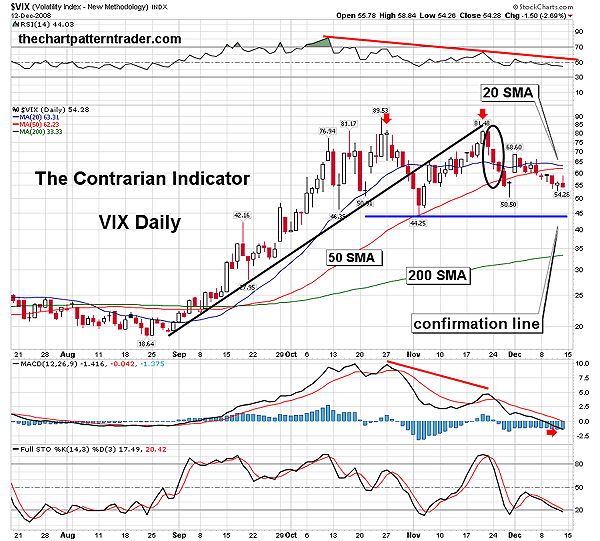
| The volatility index (VIX) gauges the fear of volatility. The VIX, a contrarian indicator, measures the implied volatility of the S&P 500 index options and can be used for spotting turning points in the market. When it peaks, the stock market is near a bottom, and when it puts in a low, it signals that the stock market becoming toppy. With a little detective work and using multiple time frames, it may help us solve the mystery of which direction the market is headed. In Figure 1, the daily chart of the volatility index (VIX), has been on a terror since early September 2008, rising from the mid-20s in late August until the it finally peaked in late October, having put in a record rise to 89.53%. During that time, the VIX formed an trendline that subsequently was penetrated on November 3, breaking below the 60 level. Over the next two trading sessions, the VIX continued in its freefall and then bounced off its 50-day simple moving average and bolstered back up. The VIX began to make its way higher, flirting with the broken trendline in its revamped rally that took it back up above 80. There it rammed into the broken trendline, which represented resistance. Then on November 24, a bearish engulfing candlestick stopped the advance dead in its tracks. That bearish pattern morphed into another, with three identical crows. This pattern is very bearish, forming three long down days with the second and third days opening at or near the previous day's close. |

|
| FIGURE 1: VIX, DAILY. The 20-day SMA has been in a excursion sideways and it could cause it to plunge below the 50-day SMA. Note that price is below both of those moving averages after forming two distinct peaks in a potential double-top pattern, with a confirmation line at 44.25%. The MACD just slid below its zero line. |
| Graphic provided by: StockCharts.com. |
| |
| These bearish candlestick patterns carved out a second peak on the VIX's daily chart, which may result in a double top pattern forming (Figure 1). The VIX continued lower and then made a recovery attempt, which failed and resulted in a lower high forming. Prices now have a lower high on the daily chart, but the VIX needs to put in a lower low to be in a confirmed downtrend. If the VIX falls below the confirmation line for the double-top pattern, which is the low at 44.25, that separates the two peaks, it would put in the lower low needed to continue the downtrend. This scenario has a high probability of coming to pass, with the moving average convergence/divergence (MACD) moving below its zero line. Meanwhile, prices are below the 20-day simple moving average (SMA), within striking distance of the 50-day SMA, and could easily pierce below it if price continues to erode on the VIX. |

|
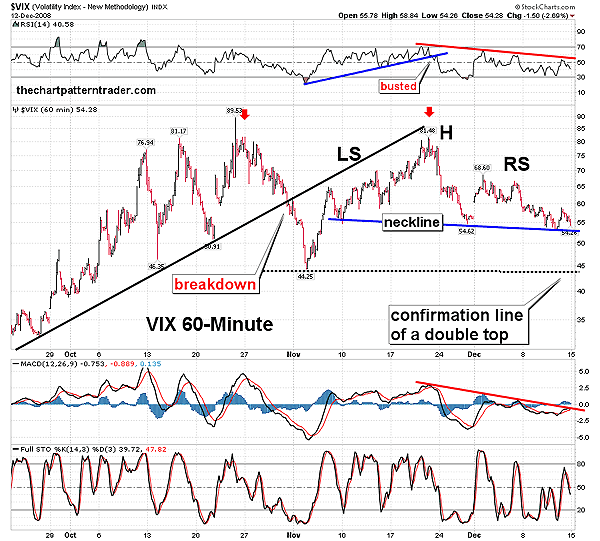
| FIGURE 2: VIX, HOURLY. Here we see that the VIX is in double jeopardy, sporting two bearish patterns. The head & shoulders top formed within the second top on the daily chart. If the MACD is unable to clear its downtrend, failing to rise above the zero line, the head & shoulders pattern will likely follow suit, breaking below its neckline. |
| Graphic provided by: StockCharts.com. |
| |
| While the VIX's daily chart runs its bearish course, another bearish pattern is looming on its hourly chart, which may allow the double-top pattern on the daily chart to penetrate its confirmation line at 44.25 (Figure 2). A head & shoulders top has been constructed within the second top that formed on the daily chart. This puts the VIX in double jeopardy, with two potential bearish pattens lingering over the VIX's daily and hourly charts. The neckline on the head & shoulders top near the 54 level, should that level be violated there, isn't much left in the way of support until the 44.25 area (which is the confirmation line of the double-top pattern on the daily chart). Figure 2 shows that the VIX 60-minute chart has formed a newly downward slope on the price chart, while its MACD is running right into a newly formed downward trend, which intersects with the zero line. If the MACD rolls back over at this barrier, the head & shoulders pattern on the hourly chart should break support and penetrate the neckline, forging a lower low on the daily chart. |

|
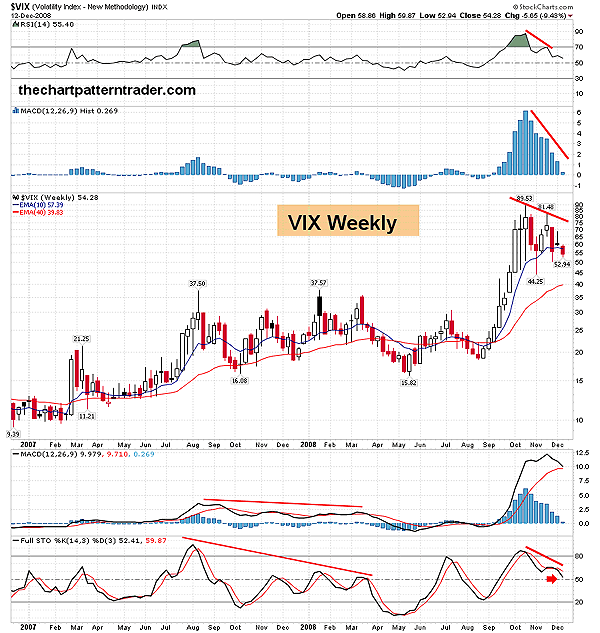
| FIGURE 3: VIX, WEEKLY. It may be that it's one, two, three strikes you're out. If the two bearish patterns play out as noted on the hourly and daily charts, they will drag the weekly chart down kicking and screaming with them. The MACD is poised for a bearish cross, while the stochastic got confirmation of a lower high and is driving right toward 50, where momentum could shift. |
| Graphic provided by: StockCharts.com. |
| |
| While the VIX is in double trouble on its daily and hourly charts, its weekly chart also appears to be in dire straits, giving some credibility to those patterns. Further clues on the VIX weekly chart (Figure 3) show an extended MACD that looks ready to get a bearish cross and roll lower. The stochastic (14, 3, 3) got confirmation of a lower high, and then violently hooked back down, where it now resides just above 50. Should that double dose of bearish chart patterns lead to further decay the VIX's price chart, then the stochastic and the MACD on the weekly chart will be tarnished. The stochastic will likely plunge below 50, as the MACD gets a bearish crossover, shifting the balance of power from the bears to the bulls, as the VIX rubber stamps its seal of approval on the recent renegade rally that has occurred in the stock market of the November lows. |
| Now, if the breakdown of the VIX continues, it doesn't necessarily mean that the stock market has seen the bottom. But for all intents and purposes, it does mean that we have a floor for now. I expect the stock market to rapidly rise higher for the short term in a bear market rally off these oversold levels. Prices will rise rapidly for a bit, but will eventually succumb to more selling pressures at key levels of resistance. The stock market needs to rise in order to allow more distribution to occur. Whether the VIX is signaling a long-term bottom, only time will tell. But for now, its bearish chart patterns keep it in double jeopardy, favoring long positions in the stock market. |
Ron Walker is an active trader and technical analyst. He operates an educational website dedicated to the study of Technical Analysis. The website offers free market analysis with daily video presentations and written commentaries. Ron is a video pioneer, being one of the first to utilize the internet producing Technical Analysis videos. His website is thechartpatterntrader.com
| Website: | thechartpatterntrader.com |
| E-mail address: | thechartpatterntrader@gmail.com |
Click here for more information about our publications!
Comments
Date: 12/17/08Rank: 3Comment:
Date: 12/23/08Rank: 5Comment:
Date: 12/30/08Rank: 5Comment: Clear explanation of how to use VIX in the price action we will see after the holidays. Low volume from 18 December onward until...what?..06 January just increases the opportunity cost to see how this indicator works in relation to the market in today s global system.

|

Request Information From Our Sponsors
- StockCharts.com, Inc.
- Candle Patterns
- Candlestick Charting Explained
- Intermarket Technical Analysis
- John Murphy on Chart Analysis
- John Murphy's Chart Pattern Recognition
- John Murphy's Market Message
- MurphyExplainsMarketAnalysis-Intermarket Analysis
- MurphyExplainsMarketAnalysis-Visual Analysis
- StockCharts.com
- Technical Analysis of the Financial Markets
- The Visual Investor
- VectorVest, Inc.
- Executive Premier Workshop
- One-Day Options Course
- OptionsPro
- Retirement Income Workshop
- Sure-Fire Trading Systems (VectorVest, Inc.)
- Trading as a Business Workshop
- VectorVest 7 EOD
- VectorVest 7 RealTime/IntraDay
- VectorVest AutoTester
- VectorVest Educational Services
- VectorVest OnLine
- VectorVest Options Analyzer
- VectorVest ProGraphics v6.0
- VectorVest ProTrader 7
- VectorVest RealTime Derby Tool
- VectorVest Simulator
- VectorVest Variator
- VectorVest Watchdog
