HOT TOPICS LIST
- MACD
- Fibonacci
- RSI
- Gann
- ADXR
- Stochastics
- Volume
- Triangles
- Futures
- Cycles
- Volatility
- ZIGZAG
- MESA
- Retracement
- Aroon
INDICATORS LIST
LIST OF TOPICS
PRINT THIS ARTICLE
by Dennis D. Peterson
For noisy data this is a useful technique.
Position: N/A
Dennis D. Peterson
Market index trading on a daily basis.
PRINT THIS ARTICLE
REL. STR OSCILL
Double Smoothing
07/23/01 03:30:54 PMby Dennis D. Peterson
For noisy data this is a useful technique.
Position: N/A
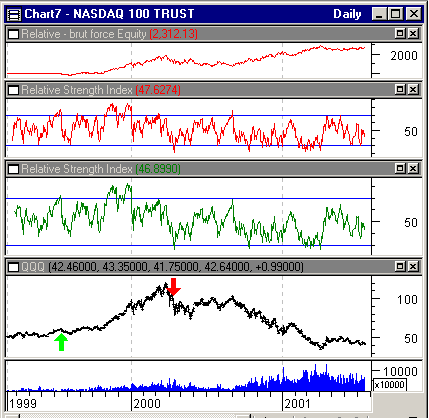
| RSI can be a noisy indicator. To eliminate some of the noise, the typical technique is to use a moving average. You can also take the moving average of the moving average, commonly referred to as double smoothing. Does RSI perform better generating buy and sell signals when doubled smoothed versus no smoothing? I system tested daily QQQ price using a buy/sell strategy that would buy when RSI is above a threshold and sell when RSI is below a threshold. I allowed the software to optimize on both periods and thresholds. I did see $1,000 grow to $2,200 (Figure 1: top chart), but the system came up with the result using one long and one short position.  Figure 1: QQQ daily price and volume (bottom two charts) with one buy signal (green arrow) and one sell signal. The system chose an RSI (green indicator- third chart from top) with a 10-day period and threshold of 70 for going long, an RSI (red indicator second chart from top) with 14-day period and threshold of 30 for going long. |
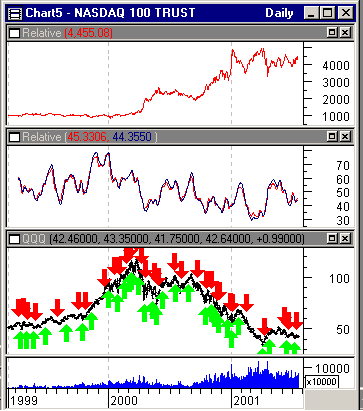
| This is not a reasonable answer of how to use RSI because it uses the fact that overall QQQ was first in one long uptrend, followed by a short sideways movement and then a downtrend. RSI (Figure 1: second and third charts from top) is clearly noisy. To be able to conduct more than two trades in two years the noise has to be taken into account. I tried a double smoothing approach using the following Metastock formulas: var1:=Mov(Mov(RSI(opt1),opt3,E),opt5,E); var2:=Mov(Mov(RSI(opt2),opt4,E),opt6,E) Both of these formulas are read the same and specifically for var1 is the following: 1. First use RSI of opt1 periods, 2. Next take the exponential moving average of RSI, using opt3 periods 3. Lastly take the exponential moving average of the moving average using opt5 periods. Opt1, Opt2, etc. are all variables that will be allowed to go through a range of values with the system calculating equity performance for each and every combination. I next set up a simple buy and sell condition namely: go long if var1>var2, go short if var1< var2. The double smoothing equity performance (Figure 2: top chart) using optimization was considerably better than RSI alone using optimization. Double smoothing RSI (Figure 2: second chart from top - var1 and var2 charted) also had the desired effect of eliminating a lot of noise |

|
| Figure 2: QQQ daily price and volume (bottom two charts) with green buy and red sell signals. Top chart is equity performance. Middle chart is double smoothed RSI. |
| Graphic provided by: MetaStock. |
| Graphic provided by: Data vendor: eSignal<. |
| |
| Would I try and trade with either? NO. What you can see (Figure 2: top chart) is that the equity using double smoothed RSI has two horrendous drawdowns, one in January of 2001 and the other in April 2001. I can fix the serious drawdowns by examining the conditions closely. I found that the drawdowns occurred with the short positions so I added the condition that a three-period linear regression slope of the double smoothed RSI be negative. The result was that serious drawdowns were eliminated but the equity grew to only about $2,500. What about using the linear regression slope of the double smoothed RSI for buy and sell signals? This is in fact about where I started. I didn't like what I saw as the system went through all the combinations for linear regression slope. I saw a lot of negative gain -- equity was reduced. In fact there were many thousands of combinations run. This, for me, is proof that the system has over-optimized. I noticed the same thing for double smoothed RSI equity (Figure 2: top chart). Did I employ a number of schemes to make RSI work better? I tried a MACD version - the difference of two moving averages of RSI. For long positions I added the condition that today's close had to be greater than yesterday's, and ever mindful of three day reversals, I also tried comparing today to three and four days ago. I noticed that sometimes the two double smoothed averages differed little so I added a condition that they be separated by an optimized amount. I also did that for the linear regression slope. No matter how many rabbits I pulled out of the trading strategy hat I couldn't get an equity performance I liked. So, why write about this? I use RSI, but in limited circumstances. I like RSI to analyze tops. I prefer to analyze a chart from a pivot, swing, volume and pattern point of view. As I went through trying to improve RSI equity performance I kept running into wedges, or three day reversals, muttering to myself that if I get rid of this last problem I am home free. Alas, nirvana eluded me. The moral to this story is that some indicators, like RSI are best used as filters to confirm conditions. You might get lucky with a bull run and think RSI is great - I suggest you need to backtest and when you try to work out all the kinks give those kinky wedges, flags, pennants their due. Better to understand them than to fight them. |
Market index trading on a daily basis.
| Title: | Staff Writer |
| Company: | Technical Analysis, Inc. |
| Address: | 4757 California Ave SW |
| Seattle, WA 98116-4499 | |
| Phone # for sales: | 206 938 0570 |
| Fax: | 206 938 1307 |
| Website: | www.traders.com |
| E-mail address: | dpeterson@traders.com |
Traders' Resource Links | |
| Charting the Stock Market: The Wyckoff Method -- Books | |
| Working-Money.com -- Online Trading Services | |
| Traders.com Advantage -- Online Trading Services | |
| Technical Analysis of Stocks & Commodities -- Publications and Newsletters | |
| Working Money, at Working-Money.com -- Publications and Newsletters | |
| Traders.com Advantage -- Publications and Newsletters | |
| Professional Traders Starter Kit -- Software | |
Click here for more information about our publications!
Comments
Date: 07/24/01Rank: Comment: Dennis Peterson
Have you ever thought od using the Profund Ultra either long or short for the first chart where you had 2 trades in 2 years. Nothing but money!
Al Thomas
Date: 07/24/01Rank: 4Comment:

Request Information From Our Sponsors
- StockCharts.com, Inc.
- Candle Patterns
- Candlestick Charting Explained
- Intermarket Technical Analysis
- John Murphy on Chart Analysis
- John Murphy's Chart Pattern Recognition
- John Murphy's Market Message
- MurphyExplainsMarketAnalysis-Intermarket Analysis
- MurphyExplainsMarketAnalysis-Visual Analysis
- StockCharts.com
- Technical Analysis of the Financial Markets
- The Visual Investor
- VectorVest, Inc.
- Executive Premier Workshop
- One-Day Options Course
- OptionsPro
- Retirement Income Workshop
- Sure-Fire Trading Systems (VectorVest, Inc.)
- Trading as a Business Workshop
- VectorVest 7 EOD
- VectorVest 7 RealTime/IntraDay
- VectorVest AutoTester
- VectorVest Educational Services
- VectorVest OnLine
- VectorVest Options Analyzer
- VectorVest ProGraphics v6.0
- VectorVest ProTrader 7
- VectorVest RealTime Derby Tool
- VectorVest Simulator
- VectorVest Variator
- VectorVest Watchdog
