HOT TOPICS LIST
- MACD
- Fibonacci
- RSI
- Gann
- ADXR
- Stochastics
- Volume
- Triangles
- Futures
- Cycles
- Volatility
- ZIGZAG
- MESA
- Retracement
- Aroon
INDICATORS LIST
LIST OF TOPICS
PRINT THIS ARTICLE
by Donald W. Pendergast, Jr.
Option volatilities are still high, and here's an interesting trade setup in one of the gold mining industry's better-performing stocks.
Position: Sell
Donald W. Pendergast, Jr.
Donald W. Pendergast is a financial markets consultant who offers specialized services to stock brokers and high net worth individuals who seek a better bottom line for their portfolios.
PRINT THIS ARTICLE
IMPLIED VOLATILITY
Kinross Gold Has Short Strangle Op
12/16/08 10:59:01 AMby Donald W. Pendergast, Jr.
Option volatilities are still high, and here's an interesting trade setup in one of the gold mining industry's better-performing stocks.
Position: Sell
| Gold has had quite a ride since bottoming at $252 in late 2001; after making an all-time high in March 2008, its price has covered a lot of territory. While some gold bulls are still calling for $5,000, some gold bears believe that the current deflationary environment will keep gold prices low for many years to come. Who's right? There is no way to tell, but one thing we do know is that gold's volatility is still in the upper part of its two-year range, offering shrewd option traders the opportunity to create nondirectional strategies that take in healthy option premiums. |

|
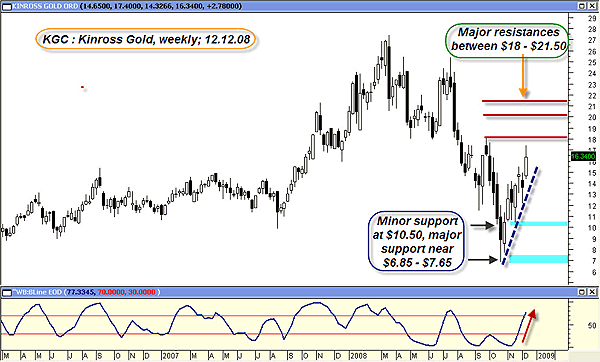
| FIGURE 1: KGC, WEEKLY. Here's a strongly rebounding stock caught between strong resistance and solid support. |
| Graphic provided by: MetaStock. |
| Graphic provided by: WB EOD B-Line from ProfitTrader for MetaStock. |
| |
| Kinross Gold (KGC), a Canadian-based gold miner, has also participated in the current updraft in precious metals prices, although its relative strength is more meager than that of DRD Gold (DROOY) and Harmony Gold Mining (HMY). A glance at KGC's weekly chart (Figure 1) shows that while upward momentum is strong, the stock is approaching a series of significant resistance (Fibonacci levels and/or previous highs) barriers. The B-line is also chugging higher, confirming the bullish price cycle, but the latest weekly candle shows that, for the moment, plenty of stock is available for sale between $16.34-17.40. There are significant support levels near $10.50 and $6.85-7.65, too. All in all, it's an image of a strongly rebounding stock that may be near a cycle high and/or due for a period of consolidation. Given that the stock appears to be neither a buy nor a sell at this juncture, how might an option-savvy trader play the current high implied volatility in KGC, using a nondirectional strategy? |

|
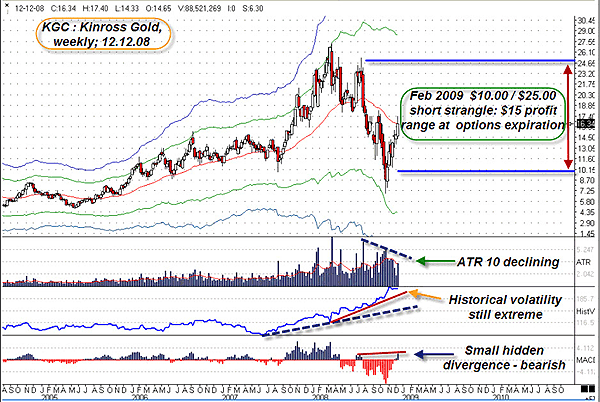
| FIGURE 2: KGC, WEEKLY. Mixed technical signals, combined with high implied volatility, suggests that the sale of a $25/$10 February 2009 strangle may be an attractive play. |
| Graphic provided by: Ensign Windows. |
| |
| Our next weekly chart (Figure 2) depicts Kinross' extremely high historical volatility, a tipoff that option premiums are likely to be liberally valued, which they are. Despite the high volatility, the trend of the average true range for the previous 10 weeks is steadily declining, the first warning that options implied volatility may soon start to deflate -- a major plus for a trader who sells options now. There is also an additional, albeit small technical clue on this chart, one that suggests a pullback in KGC may be due -- it's a small hidden divergence that's printed on the detrend oscillator. So, given all of this bizarre mix of numerology, trend, volatility, and ambivalence, how can we attempt to extract some profits from this chart pattern in Kinross? Look at the blue horizontal lines at $25.00 and at $10.00 for a clue -- we'll attempt the sale of a February 2009 $25.00/$10.00 short strangle for about $1.05 per spread. For the uninitiated, a short strangle involves the simultaneous sale of an out-of-the-money call and an out-of-the-money put, usually when option implied volatility is extreme. |
| Why is the sale of a short strangle attractive here, anyway? Well, since Kinross is bounded by fairly significant support and resistance barriers and since implied volatility is exceptionally high, the large $15 profit zone at option expiration (only 67 days away) looks awfully attractive. Even more tempting is the fact that the declining ATR 10 readings imply that volatilty may have already peaked and is about to revert to more normal levels, which is a huge plus for anyone holding a short strangle. Currently, a February 2009 $25.00/$10 short strangle can be sold for about $1.05. If KGC is less than $25 and greater than $10 at option expiration, the trader keeps all of the premiums and walks away, free and clear. He could also close the trade out early as time decay eats away at the premiums and/or implied volatility declines to a more normal level. Many traders close out a short spread like this when they can buy it back for half of what they received for it. In a worst-case scenario, the spread can be closed out if it doubles in value, a wise thing to do if the stock moves too fast in either direction right after selling the option spread. Statistically, at February option expiration, the short $25 call has only about a 16% chance of expiring in-the-money, even as the short $10 put only has a 20% chance of expiring in-the-money. |
| While this option strategy looks like a fairly low-risk proposition, a wise trader will perform a stress-test for such an option spread in the options analysis software of his choice before actually committing his margin to such a short position. The real danger with a short strangle is that the stock may continue to trend strongly after initiating the position, causing large losses on one side of the spread. For this reason, strangle sellers need to make sure that they initiate positions only when a stock or commodity is surrounded by heavy support/resistance barriers that are statistically unlikely to be breached prior to options expiration. They must also faithfully adhere to a risk-control strategy that quickly closes out any spread that gets out of control before large losses begin to accrue. |
Donald W. Pendergast is a financial markets consultant who offers specialized services to stock brokers and high net worth individuals who seek a better bottom line for their portfolios.
| Title: | Writer, market consultant |
| Company: | Linear Trading Systems LLC |
| Jacksonville, FL 32217 | |
| Phone # for sales: | 904-239-9564 |
| E-mail address: | lineartradingsys@gmail.com |
Traders' Resource Links | |
| Linear Trading Systems LLC has not added any product or service information to TRADERS' RESOURCE. | |
Click here for more information about our publications!
Comments
Date: 12/30/08Rank: 5Comment: All of Mr. Pendergast s articles are clear and valuable in their relation to each specific example.

Request Information From Our Sponsors
- StockCharts.com, Inc.
- Candle Patterns
- Candlestick Charting Explained
- Intermarket Technical Analysis
- John Murphy on Chart Analysis
- John Murphy's Chart Pattern Recognition
- John Murphy's Market Message
- MurphyExplainsMarketAnalysis-Intermarket Analysis
- MurphyExplainsMarketAnalysis-Visual Analysis
- StockCharts.com
- Technical Analysis of the Financial Markets
- The Visual Investor
- VectorVest, Inc.
- Executive Premier Workshop
- One-Day Options Course
- OptionsPro
- Retirement Income Workshop
- Sure-Fire Trading Systems (VectorVest, Inc.)
- Trading as a Business Workshop
- VectorVest 7 EOD
- VectorVest 7 RealTime/IntraDay
- VectorVest AutoTester
- VectorVest Educational Services
- VectorVest OnLine
- VectorVest Options Analyzer
- VectorVest ProGraphics v6.0
- VectorVest ProTrader 7
- VectorVest RealTime Derby Tool
- VectorVest Simulator
- VectorVest Variator
- VectorVest Watchdog
