HOT TOPICS LIST
- MACD
- Fibonacci
- RSI
- Gann
- ADXR
- Stochastics
- Volume
- Triangles
- Futures
- Cycles
- Volatility
- ZIGZAG
- MESA
- Retracement
- Aroon
INDICATORS LIST
LIST OF TOPICS
PRINT THIS ARTICLE
by Mike Carr, CMT
As the price of gold seems to have found a bottom, some gold mining stocks have shown strength and are worth buying.
Position: Buy
Mike Carr, CMT
Mike Carr, CMT, is a member of the Market Technicians Association, and editor of the MTA's newsletter, Technically Speaking. He is also the author of "Smarter Investing in Any Economy: The Definitive Guide to Relative Strength Investing," and "Conquering the Divide: How to Use Economic Indicators to Catch Stock Market Trends."
PRINT THIS ARTICLE
STRATEGIES
Anglogold Leading Gold Higher
12/15/08 10:50:48 AMby Mike Carr, CMT
As the price of gold seems to have found a bottom, some gold mining stocks have shown strength and are worth buying.
Position: Buy
| AngloGold Ashanti (AU) is a South African gold mining company. The company should be profitable this year with gold prices back above $800 an ounce and their cost of production at $486 per ounce. While the fundamentals appear solid, the prospects of a global recession could limit the demand for gold and industrial minerals the company produces. Uncertain fundamentals make technical analysis an important investment consideration. |
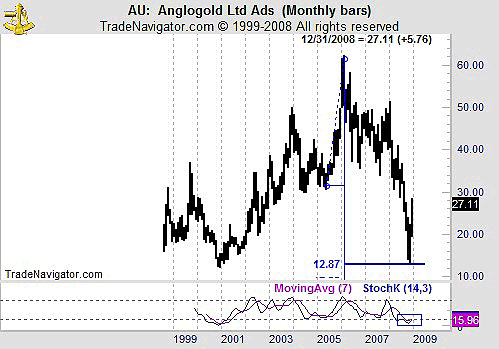
| The long-term chart of AU (Figure 1) supports a bullish argument. The price objective from the complex head & shoulders pattern was reached on a spike low. The stochastics indicator has just completed a bullish crossover. |

|
| FIGURE 1: AU, MONTHLY. The stochastic has turned positive while prices bounced off the 2000 lows. |
| Graphic provided by: Trade Navigator. |
| |
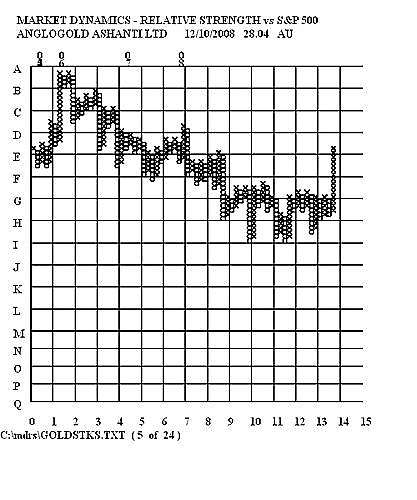
| Relative strength in AU is also bullish (Figure 2). Using a point & figure chart to measure relative strength makes it easier to spot the underlying trend and ignore the daily market noise. After an extended consolidation phase, relative strength has broken out to its highest level this year. |

|
| FIGURE 2: AU, P&F. The point & figure chart of relative strength shows that the stock has just broken out of a consolidation pattern. |
| Graphic provided by: Market Dynamics. |
| |
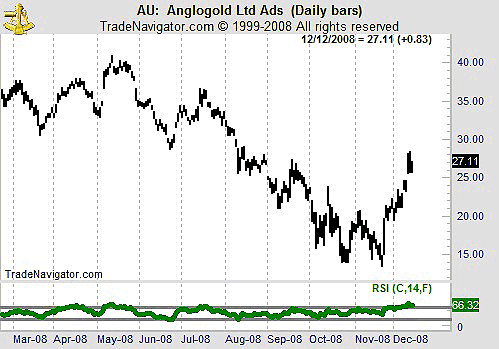
| Finally, the daily chart indicates that AU has entered at least a short-term bull market. We can see that as prices gapped up, the RSI broke above 60. Analyst Andrew Cardwell has studied this indicator extensively, and identified the concept of RSI range rules. He observed that in uptrends, the RSI will usually stay between values of 40 to 80 and in bear markets the indicator will typically fall to 20 and stay below 60. A breakout in the RSI can be used to verify the price action and confirm the entry into this trade. |

|
| FIGURE 3: AU, DAILY. With the RSI in a bullish range and price gapping higher, AU represents a buy at current levels. |
| Graphic provided by: Trade Navigator. |
| |
| Technical analysis often involves incorporating a number of signals into a single opinion. In this case, multiple time frames, multiple indicators, and price itself indicate AU is a buy. |
Mike Carr, CMT, is a member of the Market Technicians Association, and editor of the MTA's newsletter, Technically Speaking. He is also the author of "Smarter Investing in Any Economy: The Definitive Guide to Relative Strength Investing," and "Conquering the Divide: How to Use Economic Indicators to Catch Stock Market Trends."
| Website: | www.moneynews.com/blogs/MichaelCarr/id-73 |
| E-mail address: | marketstrategist@gmail.com |
Click here for more information about our publications!
Comments
Date: 01/01/09Rank: 4Comment:

Request Information From Our Sponsors
- StockCharts.com, Inc.
- Candle Patterns
- Candlestick Charting Explained
- Intermarket Technical Analysis
- John Murphy on Chart Analysis
- John Murphy's Chart Pattern Recognition
- John Murphy's Market Message
- MurphyExplainsMarketAnalysis-Intermarket Analysis
- MurphyExplainsMarketAnalysis-Visual Analysis
- StockCharts.com
- Technical Analysis of the Financial Markets
- The Visual Investor
- VectorVest, Inc.
- Executive Premier Workshop
- One-Day Options Course
- OptionsPro
- Retirement Income Workshop
- Sure-Fire Trading Systems (VectorVest, Inc.)
- Trading as a Business Workshop
- VectorVest 7 EOD
- VectorVest 7 RealTime/IntraDay
- VectorVest AutoTester
- VectorVest Educational Services
- VectorVest OnLine
- VectorVest Options Analyzer
- VectorVest ProGraphics v6.0
- VectorVest ProTrader 7
- VectorVest RealTime Derby Tool
- VectorVest Simulator
- VectorVest Variator
- VectorVest Watchdog
