HOT TOPICS LIST
- MACD
- Fibonacci
- RSI
- Gann
- ADXR
- Stochastics
- Volume
- Triangles
- Futures
- Cycles
- Volatility
- ZIGZAG
- MESA
- Retracement
- Aroon
INDICATORS LIST
LIST OF TOPICS
PRINT THIS ARTICLE
by Paolo Pezzutti
The breakout of the head & shoulders neckline at 900 would be an important indication for the continuation of the up leg.
Position: Accumulate
Paolo Pezzutti
Author of the book "Trading the US Markets - A Comprehensive Guide to US Markets for International Traders and Investors" - Harriman House (July 2008)
PRINT THIS ARTICLE
HEAD & SHOULDERS
Emini S&P Rebound Could Continue
12/15/08 10:41:06 AMby Paolo Pezzutti
The breakout of the head & shoulders neckline at 900 would be an important indication for the continuation of the up leg.
Position: Accumulate
| Bad news hit the markets between Thursday and Friday (December 11 and 12). First, an effort to salvage a proposed $14 billion rescue plan for the auto industry collapsed as Republicans and Democrats failed to agree on the timing of wage cuts for union workers. The viability of this important industry is questioned in a difficult moment for the US economy. Second, Bernard Madoff, the former NASDAQ chairman, was charged with massive fraud. According to the news media, Madoff admitted to defrauding clients for up to $50 billion in a Ponzi scheme that continued over a number of years. |
| According to the December 11th Bloomberg, Senate Majority Leader Harry Reid said before the vote in Washington, "I dread looking at Wall Street tomorrow ... it's not going to be a pleasant sight." Markets opened with a big gap down on Friday morning as if the world economy depended on the auto bailout. The collapse of the auto bailout was seen as a negative event for markets, but as usual, markets like to surprise investors and those who think they can predict them. After the negative open, markets managed to close positive for the day. This means that bad news after an initial emotional impact was perceived as a buying opportunity. The emini S&P eventually printed a hammer, which sets an important support for the next session. |

|
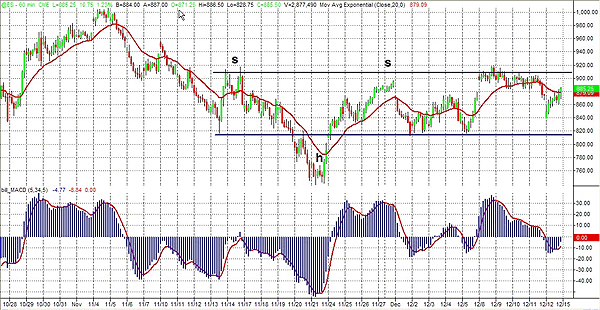
| FIGURE 1: EMINI S&P, HOURLY. The emini is developing a head & shoulders. The first attempt to break out the neckline has failed. |
| Graphic provided by: TradeStation. |
| |
| As you can see in Figure 1, the emini is developing a head & shoulders pattern. The neckline is at about 900 with an objective to the upside above 1000. In the past days, the emini tested without success at the 900 level. The failure of the neckline breakout at 900 brought prices again toward the vital support of 820. The 820 level has been tested already twice and Friday's low at 828 confirms its importance. Prices are moving within the trading range 820–900, but the fade of Friday's gap appears to be bullish. During the next week, the emini should test again the 900 resistance, a key level to see a longer-term rebound in the next weeks with a potential objective of more than 10% to the upside. On the longer time frames, I do not see any reversal indications of the downtrend so far. |

|
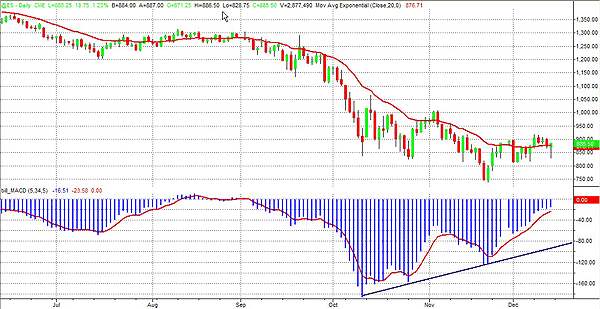
| FIGURE 2: EMINI S&P, DAILY. The emini has printed two positive divergences of the MACD. The hammer low provides an important support level for the continuation of the rebound. |
| Graphic provided by: TradeStation. |
| |
| In the daily time frame (Figure 2), you can see that the emini has developed two positive divergences of the moving average convergence/divergence (MACD). We know that divergences do not provide sufficient elements to justify a reversal. They have to be put in context to weigh the risk-reward opportunities. That is why it is too early to say if the markets have bottomed. The move from 740 to 900 in the past three weeks might have just completed the rebound before moving to the downside and developing another leg. At the same time, there is the potential to continue the up move should the breakout of 900 occur. However, after the December 1st drop of almost 80 points, prices recovered quickly and the closure of Friday's opening gap is also a positive indication that the market is starting to react positively to bad news and may have found a solid base for the moment. |
Author of the book "Trading the US Markets - A Comprehensive Guide to US Markets for International Traders and Investors" - Harriman House (July 2008)
| Address: | VIA ROBERTO AGO 26 POSTAL CODE 00166 |
| Rome, ITALY | |
| Phone # for sales: | +393357540708 |
| E-mail address: | pezzutti.paolo@tiscali.it |
Click here for more information about our publications!
Comments
Date: 12/16/08Rank: 2Comment:

Request Information From Our Sponsors
- StockCharts.com, Inc.
- Candle Patterns
- Candlestick Charting Explained
- Intermarket Technical Analysis
- John Murphy on Chart Analysis
- John Murphy's Chart Pattern Recognition
- John Murphy's Market Message
- MurphyExplainsMarketAnalysis-Intermarket Analysis
- MurphyExplainsMarketAnalysis-Visual Analysis
- StockCharts.com
- Technical Analysis of the Financial Markets
- The Visual Investor
- VectorVest, Inc.
- Executive Premier Workshop
- One-Day Options Course
- OptionsPro
- Retirement Income Workshop
- Sure-Fire Trading Systems (VectorVest, Inc.)
- Trading as a Business Workshop
- VectorVest 7 EOD
- VectorVest 7 RealTime/IntraDay
- VectorVest AutoTester
- VectorVest Educational Services
- VectorVest OnLine
- VectorVest Options Analyzer
- VectorVest ProGraphics v6.0
- VectorVest ProTrader 7
- VectorVest RealTime Derby Tool
- VectorVest Simulator
- VectorVest Variator
- VectorVest Watchdog
