HOT TOPICS LIST
- MACD
- Fibonacci
- RSI
- Gann
- ADXR
- Stochastics
- Volume
- Triangles
- Futures
- Cycles
- Volatility
- ZIGZAG
- MESA
- Retracement
- Aroon
INDICATORS LIST
LIST OF TOPICS
PRINT THIS ARTICLE
by Chaitali Mohile
Cisco has breached a head & shoulders neckline support. The stock has turned significantly weak as a result, and no bullish efforts can sustain.
Position: Sell
Chaitali Mohile
Active trader in the Indian stock markets since 2003 and a full-time writer. Trading is largely based upon technical analysis.
PRINT THIS ARTICLE
CANDLESTICK CHARTING
Cisco Opens Fresh Selling Opportunities
12/15/08 11:56:11 AMby Chaitali Mohile
Cisco has breached a head & shoulders neckline support. The stock has turned significantly weak as a result, and no bullish efforts can sustain.
Position: Sell
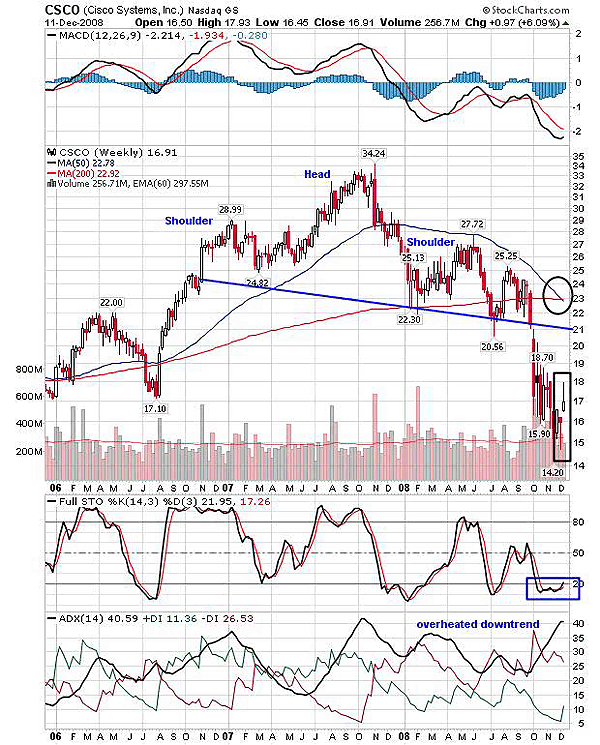
| In my earlier article as of 09/05/08, "Is Cisco Losing Support?" I mentioned the strong bearish formation on the charts of Cisco (CSCO) leading to a huge drop in price levels. The stock has broken below the head & shoulders neckline support and is on track of achieving its target. The target calculated in my previous article was around 9.06. Cisco plunged to 14.20 below the neckline support at 21. In Figure 1, the head & shoulders pattern along with the neckline support has been marked. On the chart (Figure 1), new bearish indications occurred that could drag the stock towards the minimum estimated level, bringing with it fresh selling levels. |
| In the past two weeks, CSCO has formed two bearish reversal candlestick patterns. The marked circle in Figure 1 shows a hanging man and a shooting star after the gap-up opening. The stock is in a robust downtrend, but the hanging man occurred after a week's upside move and the candle occurred near the week's highs. If the candle formed near the week's low, then the pattern could be called a hammer. which is a bullish reversal pattern. Perhaps the highly oversold stochastic (14,3,3) encouraged the pullback, and the stock gapped up. The current week is forming the shooting star that is another bearish reversal pattern. The shooting star indicates resistance to move higher, which harms the bullish sentiments of the traders. In addition, the 50-day moving average and 200-day moving average are converging, forming a bearish crossover. So the bearish candlesticks patterns and bearish moving average crossover would give strength to the bears. |

|
| FIGURE 1: CSCO, WEEKLY. The hanging man, the shooting star, and the bearish moving average crossover weaken the stock. These weak clues along with the bearish indicators the stock may soon hit the potential target at 9.06. |
| Graphic provided by: StockCharts.com. |
| |
| The moving average convergence/divergence (MACD) (12,26,9) is in negative territory. The overheated downtrend indicated by the average directional movement index (ADX) (14) might cool off after declining. The full stochastic (14,3,3) would encourage the pullback rally only if the oscillator surges and sustains above the 20 levels. Therefore, the picture looks more favorable for the bears. Hence, I would recommend short-selling below 17 with the long-term target of 9.06. |

|
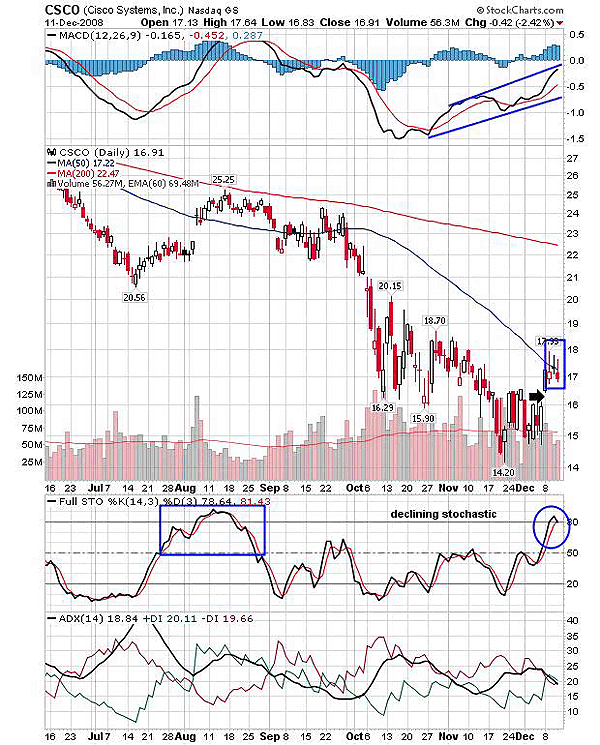
| FIGURE 2: CSCO, DAILY. This chart suggests the consolidation under the resistance of the 50-day MA. |
| Graphic provided by: StockCharts.com. |
| |
| The price chart in Figure 2 shows the cluster of dojis closing below the 50-day moving average resistance. Among the three doji, two are shooting stars, and the one in the middle is a simple doji, indicating indecision. According to Figure 2, the stochastic has failed to establish support at overbought levels. So currently, the stochastic (14,3,3) is more likely to decline from the overbought levels, resulting in a price slump as well. The ADX (14) indicates a weak trend that might lead to consolidation under the various bearish pressures. The MACD (12,26,9), though, has rallied higher in negative territory and has not surged above the zero line. So Figure 2 suggests the possibility of consolidation under the resistance of the 50-day MA, but none of the indicators show a bullish force to pull CSCO higher. |
| Thus, the big picture indicates a downside rally underway toward the target of 9.06. Traders can strike the short sell below 17 levels and ride the bears. |
Active trader in the Indian stock markets since 2003 and a full-time writer. Trading is largely based upon technical analysis.
| Company: | Independent |
| Address: | C1/3 Parth Indraprasth Towers. Vastrapur |
| Ahmedabad, Guj 380015 | |
| E-mail address: | chaitalimohile@yahoo.co.in |
Traders' Resource Links | |
| Independent has not added any product or service information to TRADERS' RESOURCE. | |
Click here for more information about our publications!
Comments
Date: 12/16/08Rank: 1Comment:

Request Information From Our Sponsors
- StockCharts.com, Inc.
- Candle Patterns
- Candlestick Charting Explained
- Intermarket Technical Analysis
- John Murphy on Chart Analysis
- John Murphy's Chart Pattern Recognition
- John Murphy's Market Message
- MurphyExplainsMarketAnalysis-Intermarket Analysis
- MurphyExplainsMarketAnalysis-Visual Analysis
- StockCharts.com
- Technical Analysis of the Financial Markets
- The Visual Investor
- VectorVest, Inc.
- Executive Premier Workshop
- One-Day Options Course
- OptionsPro
- Retirement Income Workshop
- Sure-Fire Trading Systems (VectorVest, Inc.)
- Trading as a Business Workshop
- VectorVest 7 EOD
- VectorVest 7 RealTime/IntraDay
- VectorVest AutoTester
- VectorVest Educational Services
- VectorVest OnLine
- VectorVest Options Analyzer
- VectorVest ProGraphics v6.0
- VectorVest ProTrader 7
- VectorVest RealTime Derby Tool
- VectorVest Simulator
- VectorVest Variator
- VectorVest Watchdog
