HOT TOPICS LIST
- MACD
- Fibonacci
- RSI
- Gann
- ADXR
- Stochastics
- Volume
- Triangles
- Futures
- Cycles
- Volatility
- ZIGZAG
- MESA
- Retracement
- Aroon
INDICATORS LIST
LIST OF TOPICS
PRINT THIS ARTICLE
by Donald W. Pendergast, Jr.
After enduring a major multimonth bear market, iShares Silver Trust is forming a potentially bullish pattern.
Position: Accumulate
Donald W. Pendergast, Jr.
Donald W. Pendergast is a financial markets consultant who offers specialized services to stock brokers and high net worth individuals who seek a better bottom line for their portfolios.
PRINT THIS ARTICLE
CHART ANALYSIS
iShares Silver Trust Races For A Pennant
12/17/08 12:19:43 AMby Donald W. Pendergast, Jr.
After enduring a major multimonth bear market, iShares Silver Trust is forming a potentially bullish pattern.
Position: Accumulate
| Silver bugs are an unusual bunch in that they tend to be even more diehard in their belief that silver is real money than gold bugs are in asserting their claims that gold is the only legitimate form of currency. Even after watching their beloved metal plummet like a ton of lead -- from nearly $21 all the way down to the sub-$9 area -- silver bugs remain steadfast in their opinion that the poor man's gold is ultimately destined for prices ranging anywhere from $30, $50, or even $100 to who knows how high if the commodity bull market can regain its footing. While no one knows if silver will ever see $15 again, much less $50, the weekly and daily chart patterns of the iShares Silver Trust (SLV), an exchange-traded fund that owns approximately 214 million ounces of silver (AG), are presenting some technical patterns that suggest that this precious metal may be preparing for another leg higher. The weekly chart offers several interesting technical clues. |

|
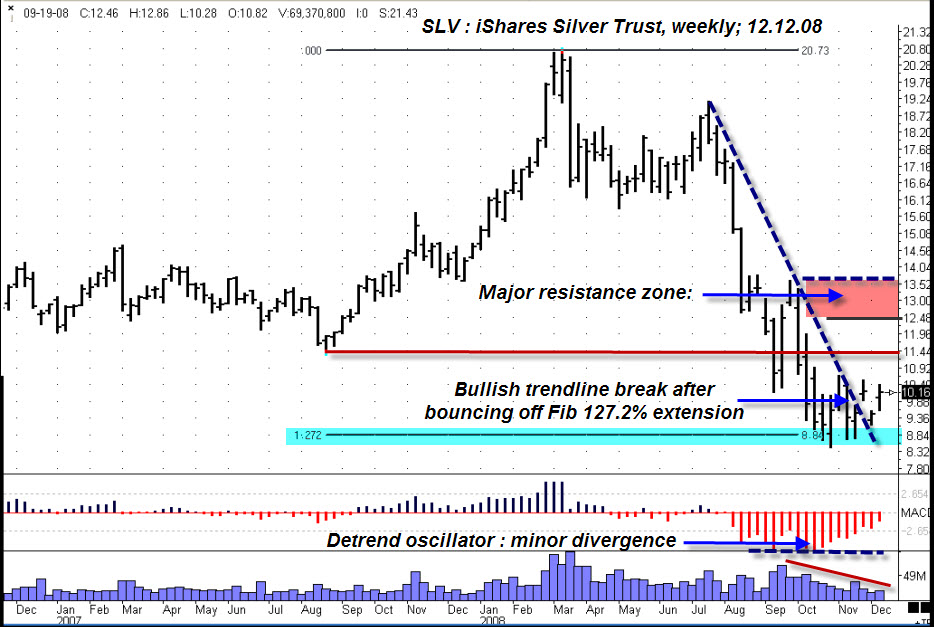
| A mildly bullish COT report, positive price-momentum divergence, and a Fibonacci 127.2% expansion ratio are the key technical highlights. |
| Graphic provided by: Ensign Windows. |
| |
| The weekly chart (Figure 1) shows the bottoming phase that occurred near a Fibonacci 127.2% expansion level even as a mildly bullish price-momentum divergence printed on the detrend oscillator. Of greater interest is the current Commitment of Traders (COT) report for silver futures; commercial interests appear to be backing off a bit on long acquisitions even as large speculators (hedge funds, etc) are taking up the slack. Such movement in the COT data sometimes precedes a substantial rally, but only time will tell. As expected, SLV has significant overhead resistance, with the $12.50-14.00 zone offering some of the heaviest clusters of Fibonacci retracement confluences. |

|
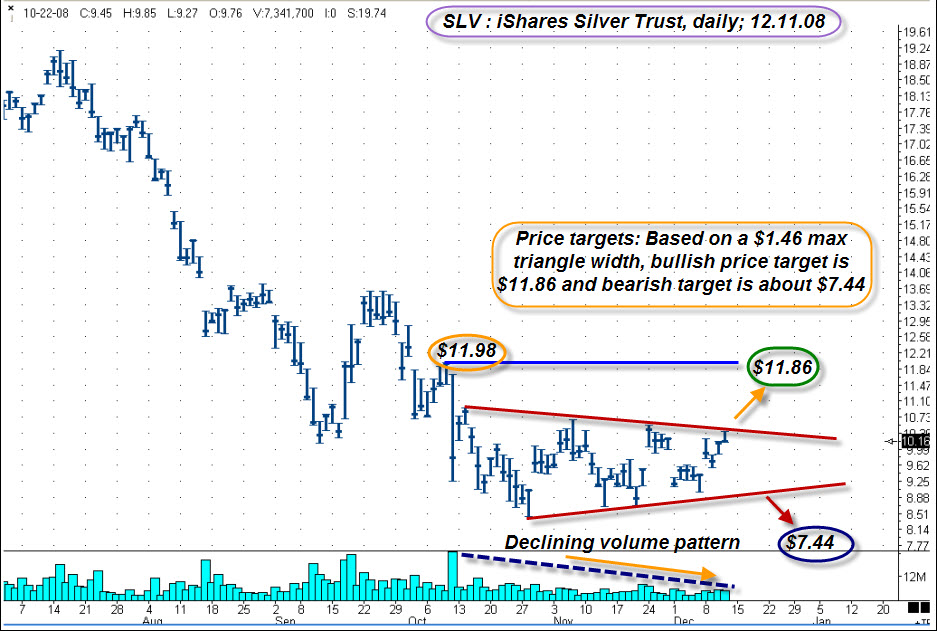
| FIGURE 2: SLV, DAILY. A triangle pattern forms on declining volume. |
| Graphic provided by: Ensign Windows. |
| |
| The most notable feature on the daily graph of SLV (Figure 2) is the well-framed triangle/wedge that has formed on progressively lower volume. Right now, price is touching the upper channel line, and if price successfully breaks upward, the triangle pattern suggests that a measured move (based on the $1.46 maximum width of the triangle) up to about $11.86 is in order. That's pretty close to the early October high of $11.98, and it's going to be a significant resistance level for this exchange traded fund (ETF) to overcome. Additional Fibonacci resistance lies just beyond that at $12.19. Conversely, if SLV breaks lower out of the triangle, a trip down to $7.44 is a possibility. The precious metals markets have been very strong lately, so you can bet that many traders will be watching for any breakout (or fakeout) moves higher from SLV's triangle. |
| While at first glance, chart patterns like the triangle, flag, and head & shoulders seem like no-brainers based on typical successful breakout ratios, wise traders also realize that the more popular a pattern is, the higher the possibility there is of a spectacular pattern failure. Let's face it, if everybody anticipated one outcome, who's left to take the other side of the trade? Some of the most profitable trades occur as savvy traders fade the anticipated trade entries of the "sure-thing" traders, hoping for a pattern failure move to react violently in the other direction. Therefore, base your trading decisions on more than just a popular chart pattern or two -- train yourself to look at the markets in ways that sometimes conflict with what "everyone" already assumes to be the truth, because sometimes what everybody knows is completely wrong. |
Donald W. Pendergast is a financial markets consultant who offers specialized services to stock brokers and high net worth individuals who seek a better bottom line for their portfolios.
| Title: | Writer, market consultant |
| Company: | Linear Trading Systems LLC |
| Jacksonville, FL 32217 | |
| Phone # for sales: | 904-239-9564 |
| E-mail address: | lineartradingsys@gmail.com |
Traders' Resource Links | |
| Linear Trading Systems LLC has not added any product or service information to TRADERS' RESOURCE. | |
Click here for more information about our publications!
Comments
Date: 12/16/08Rank: 3Comment:

Request Information From Our Sponsors
- StockCharts.com, Inc.
- Candle Patterns
- Candlestick Charting Explained
- Intermarket Technical Analysis
- John Murphy on Chart Analysis
- John Murphy's Chart Pattern Recognition
- John Murphy's Market Message
- MurphyExplainsMarketAnalysis-Intermarket Analysis
- MurphyExplainsMarketAnalysis-Visual Analysis
- StockCharts.com
- Technical Analysis of the Financial Markets
- The Visual Investor
- VectorVest, Inc.
- Executive Premier Workshop
- One-Day Options Course
- OptionsPro
- Retirement Income Workshop
- Sure-Fire Trading Systems (VectorVest, Inc.)
- Trading as a Business Workshop
- VectorVest 7 EOD
- VectorVest 7 RealTime/IntraDay
- VectorVest AutoTester
- VectorVest Educational Services
- VectorVest OnLine
- VectorVest Options Analyzer
- VectorVest ProGraphics v6.0
- VectorVest ProTrader 7
- VectorVest RealTime Derby Tool
- VectorVest Simulator
- VectorVest Variator
- VectorVest Watchdog
