HOT TOPICS LIST
- MACD
- Fibonacci
- RSI
- Gann
- ADXR
- Stochastics
- Volume
- Triangles
- Futures
- Cycles
- Volatility
- ZIGZAG
- MESA
- Retracement
- Aroon
INDICATORS LIST
LIST OF TOPICS
PRINT THIS ARTICLE
by Chaitali Mohile
The Energy Select Sector SPDR has formed a descending triangle. Can the upward breakout of the bearish pattern sustain, indicating a major trend reversal?
Position: Buy
Chaitali Mohile
Active trader in the Indian stock markets since 2003 and a full-time writer. Trading is largely based upon technical analysis.
PRINT THIS ARTICLE
DESCENDING TRIANGLES
Energy Sector SPDR Undergoing Trend Reversal
12/12/08 11:17:06 AMby Chaitali Mohile
The Energy Select Sector SPDR has formed a descending triangle. Can the upward breakout of the bearish pattern sustain, indicating a major trend reversal?
Position: Buy
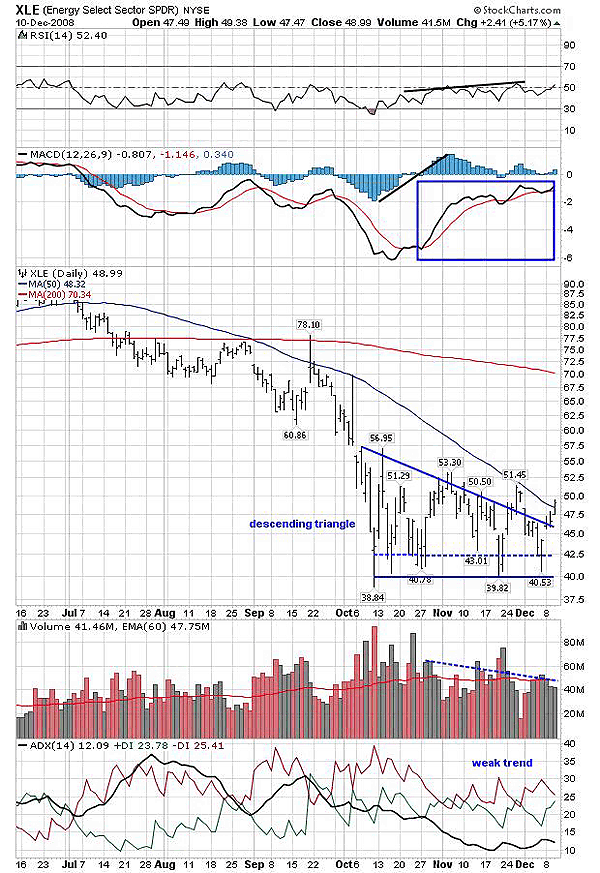
| The Energy Select Sector SPDR (XLE) has formed a descending triangle while consolidating at the bottom. The descending triangle is a continuation pattern in a downtrend that breaks in a downward direction. But if the triangle breaks in the opposite direction, a major trend reversal signal appears on the chart. In Figure 1, XLE formed a descending triangle with the flat bottom that is the support line at 40 levels (also known as the buyer's line). Above the lowest support, another support area is marked with a dotted line at 42 levels. The lower highs formed the descending line known as the seller's line. To trade the triangle, the traders enter short positions from the seller's line with the target of the buyer's line (the flat line), and a long trade is possible from the support line (again the buyer's line), with the target of the declining seller's line. The volume in Figure 1 has diminished as both lines of the triangle have converged. Since the trading range narrows, the trading volume also reduces. |

|
| FIGURE 1: XLE, DAILY. The descending triangle is formed at the bottom. The upside breakout would generate bullish reversal signals. |
| Graphic provided by: StockCharts.com. |
| |
| XLE has breached the seller's line, indicating the trend reversal possibility. In Figure 1, the immediate resistance of the 50-day moving average (MA) is also violated, but for the confirmed breakout, XLE has to sustain above the newly formed support. The relative strength index (RSI) (14) shows positive divergence along with good buying opportunities if the support at the 50 levels is established. The moving average convergence/divergence (MACD) (12,26,9) is also rallying higher than the price movement, so the positive divergences on both indicators suggest the stable breakout. The MACD histogram has also established support over the zero line in positive territory, so the indicators are likely to support the breakout and the upcoming trend. |
| But the trend indicator, the average directional movement index (ADX) (14), shows a weak trend and increasing buying pressure indicated by the positive directional index (+DI). Earlier, XLE failed to surge above the seller's line due to lack of buying pressure. The +DI and the negative directional index (-DI) are ready to collide again, and therefore, we would be watchful at current levels as history may repeat itself. But looking at the current rally across the globe, XLE would continue on a bullish path. Remember, we cannot trade in anticipation. |
| XLE is likely to reverse the downtrend with the 50-day MA support and the positive divergences by momentum indicators. |
Active trader in the Indian stock markets since 2003 and a full-time writer. Trading is largely based upon technical analysis.
| Company: | Independent |
| Address: | C1/3 Parth Indraprasth Towers. Vastrapur |
| Ahmedabad, Guj 380015 | |
| E-mail address: | chaitalimohile@yahoo.co.in |
Traders' Resource Links | |
| Independent has not added any product or service information to TRADERS' RESOURCE. | |
Click here for more information about our publications!
Comments
Date: 12/16/08Rank: 5Comment: Solid technical analysis and clear explaination. Since the last bar on 10DEC, the 50-day SMA is supporting price and my proprietary 10-30 MA Crossover indicator signaled a bullish condition on 12DEC.

Request Information From Our Sponsors
- VectorVest, Inc.
- Executive Premier Workshop
- One-Day Options Course
- OptionsPro
- Retirement Income Workshop
- Sure-Fire Trading Systems (VectorVest, Inc.)
- Trading as a Business Workshop
- VectorVest 7 EOD
- VectorVest 7 RealTime/IntraDay
- VectorVest AutoTester
- VectorVest Educational Services
- VectorVest OnLine
- VectorVest Options Analyzer
- VectorVest ProGraphics v6.0
- VectorVest ProTrader 7
- VectorVest RealTime Derby Tool
- VectorVest Simulator
- VectorVest Variator
- VectorVest Watchdog
- StockCharts.com, Inc.
- Candle Patterns
- Candlestick Charting Explained
- Intermarket Technical Analysis
- John Murphy on Chart Analysis
- John Murphy's Chart Pattern Recognition
- John Murphy's Market Message
- MurphyExplainsMarketAnalysis-Intermarket Analysis
- MurphyExplainsMarketAnalysis-Visual Analysis
- StockCharts.com
- Technical Analysis of the Financial Markets
- The Visual Investor
