HOT TOPICS LIST
- MACD
- Fibonacci
- RSI
- Gann
- ADXR
- Stochastics
- Volume
- Triangles
- Futures
- Cycles
- Volatility
- ZIGZAG
- MESA
- Retracement
- Aroon
INDICATORS LIST
LIST OF TOPICS
PRINT THIS ARTICLE
by Alan R. Northam
XRT made a market low in mid-November 2008 and has been rallying higher over the last month. Is this rally a market correction or the beginning of a new bull market trend?
Position: N/A
Alan R. Northam
Alan Northam lives in the Dallas, Texas area and as an electronic engineer gave him an analytical mind from which he has developed a thorough knowledge of stock market technical analysis. His abilities to analyze the future direction of the stock market has allowed him to successfully trade of his own portfolio over the last 30 years. Mr. Northam is now retired and trading the stock market full time. You can reach him at inquiry@tradersclassroom.com or by visiting his website at http://www.tradersclassroom.com. You can also follow him on Twitter @TradersClassrm.
PRINT THIS ARTICLE
ELLIOTT WAVE
Checking Out Retail
12/11/08 11:56:52 AMby Alan R. Northam
XRT made a market low in mid-November 2008 and has been rallying higher over the last month. Is this rally a market correction or the beginning of a new bull market trend?
Position: N/A
| According to Elliott wave theory, once a market makes a major market top, that market will correct in three waves. These three waves have been defined by Elliott wave as an ABC zigzag. In the case where the market made a major bull market top, an ABC zigzag unfolds as five waves down forming wave (A), three waves up forming wave (B), followed by a final five waves down that forms wave (C). Upon completion of the ABC zigzag correction, the theory further states that a new market trend will develop in the upward direction. |
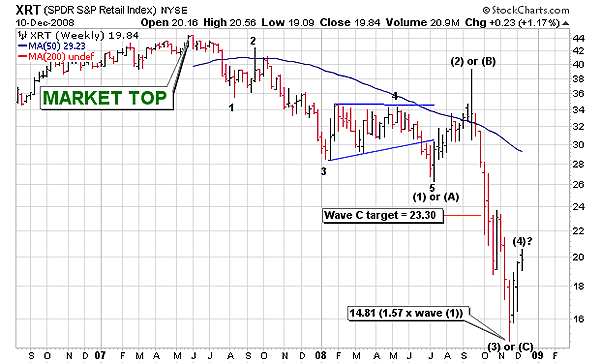
| Figure 1 shows the weekly bar chart of the SPDR S&P Retail Index (XRT). This chart shows that XRT made a major bull market top in early June 2007. Since then, XRT has unfolded in five nonoverlapping waves. The problem with labeling the completion of these first five waves down as wave (A) comes in identifying the degree of trend — in other words, how large is the ABC zigzag going to be with respect to price. Are these first five waves really the end of wave (A) or just the beginning? And will a much larger five-wave down really complete wave (A)? So until the wave structure clearly identifies itself, it is necessary to keep track of all the alternatives. Therefore, I have labeled wave (1) or (A) in labeling these first five waves to the downside. Following wave (1) or (A), XRT rallied from early July 2008 to mid-September to complete wave (2) or (B). From mid-September, the market resumed its selloff through mid-November to complete wave (3) or (C). If mid-November truly is the completion of the ABC zigzag correction, this would indicate that the bear market is over for the retail sector and a new bull market is emerging. This would also bode well for an economic recovery. However, if this is truly just the completion of wave (3), then the retail sector has a very long way yet to go on the downside, as this would mean that wave (A) of an ABC zigzag market correction is still unfolding. |

|
| FIGURE 1: XRT, WEEKLY. Here's the weekly price chart of SPDR S&P Retail Index. This figure shows the Elliott wave count and shows that either wave (3) or wave (C) was complete in mid-November 2008. |
| Graphic provided by: StockCharts.com. |
| |
| The market has given us three signs that could help us determine if wave (A) or wave (3) was completed in mid-November. The first sign was the expected target price for the completion of wave (C). To determine this price target, we take the price of XRT at the bull market top and divide it by the low price at the completion of the first five waves down, which occurred in early July 2007. We then take this quotient and divide it into the price high of wave (2) or (B) to arrive at a price target for the completion of wave (C) of 23.30. From Figure 1 we see that this price target was hit at the end of September 2008 and the retail sector fell significantly below this price target. This calculated price target for the completion of wave (C) is simply a guideline and is not a hard rule, so it is possible for wave (C) to continue lower. The second sign is given by the length of wave (3) or (C). The length of wave 3s are typically 1.618 times the length of wave 1. As you can see from Figure 1, the downward trend from mid-September 2008 to mid-November was 1.57 times the length of wave (1), which is close enough to 1.618 to be wave (3). The third sign comes from the development of the wave structure of the current rally that started in mid-November. To examine this wave structure, we turn to the daily price chart in Figure 2. |
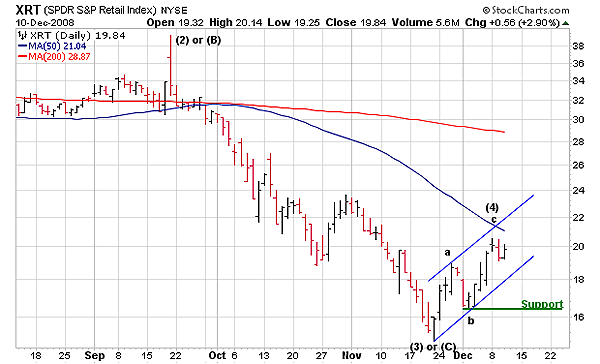
| Figure 2 shows the daily bar chart of XRT. The area of this chart that we want to examine is the rally from November 24, 2008, to the present. There are two possible explanations for this market rally: one is that it is the beginning of a new bull market and the other is that it is simply a market correction in an ongoing bear market. To determine which of these possibilities is correct, we must examine the rally to date. First, we will examine if the current rally is the beginning of a new bull market. If the current rally is truly a new bull market in the making, then price must continue higher from its current price level. Price must break above and stay above the 50-day moving average. Beyond that, price must also break above and stay above the 200-day moving average. Since XRT has done neither, it is still too early to determine if the retail market sector is in the early stage of a new bull market. Now let's examine the possibility of the current rally being corrective. If this rally is corrective, then it looks to be developing in an ABC zigzag pattern. An ABC zigzag is made up of an a-wave, b-wave, and a c-wave. Further, wave c is usually the same length as wave a. From the wave formation, it looks like wave a and wave c are the same length. Therefore, if this is an ABC zigzag market correction, then the correction looks complete and the market should start selling off immediately. A close below the support line drawn off the b-wave low will help to confirm that XRT is headed lower. However, if XRT continues to trade higher, then perhaps a new bull market is emerging. |

|
| FIGURE 2: XRT, DAILY. This figure shows the detail of the rally from late November and shows that Elliott wave (4) could be complete. A move below the support line will confirm the completion of wave (4). However, a close above the 50-day moving average could invalidate the wave count and signal that a new bull market is emerging. |
| Graphic provided by: StockCharts.com. |
| |
| In conclusion, XRT looks like it has much further to fall before completing its ABC zigzag market correction. Looking at the evidence, the price target for the completion of wave (C) down has long ago been surpassed, which makes the downward move from September to November look more like wave (3) than wave (C). Further, the downward move from September to November is almost exactly 1.618 times the length of wave (1), also making this downward move look more like wave (3) than wave (C). Finally, the rally from late November looks corrective, with wave c equal to the length of wave a. Confirmation that XRT has much further to fall will come with a move below support drawn off the low of wave b, and beyond that, a move below the low of wave (3) or (C). However, should the market continue higher and close significantly higher than the 50-day moving average and should the 50-day moving average turn upward, then a new bull market most likely began in late November. |
Alan Northam lives in the Dallas, Texas area and as an electronic engineer gave him an analytical mind from which he has developed a thorough knowledge of stock market technical analysis. His abilities to analyze the future direction of the stock market has allowed him to successfully trade of his own portfolio over the last 30 years. Mr. Northam is now retired and trading the stock market full time. You can reach him at inquiry@tradersclassroom.com or by visiting his website at http://www.tradersclassroom.com. You can also follow him on Twitter @TradersClassrm.
| Garland, Tx | |
| Website: | www.tradersclassroom.com |
| E-mail address: | inquiry@tradersclassroom.com |
Click here for more information about our publications!
Comments
Date: 12/16/08Rank: 2Comment:

|

Request Information From Our Sponsors
- StockCharts.com, Inc.
- Candle Patterns
- Candlestick Charting Explained
- Intermarket Technical Analysis
- John Murphy on Chart Analysis
- John Murphy's Chart Pattern Recognition
- John Murphy's Market Message
- MurphyExplainsMarketAnalysis-Intermarket Analysis
- MurphyExplainsMarketAnalysis-Visual Analysis
- StockCharts.com
- Technical Analysis of the Financial Markets
- The Visual Investor
- VectorVest, Inc.
- Executive Premier Workshop
- One-Day Options Course
- OptionsPro
- Retirement Income Workshop
- Sure-Fire Trading Systems (VectorVest, Inc.)
- Trading as a Business Workshop
- VectorVest 7 EOD
- VectorVest 7 RealTime/IntraDay
- VectorVest AutoTester
- VectorVest Educational Services
- VectorVest OnLine
- VectorVest Options Analyzer
- VectorVest ProGraphics v6.0
- VectorVest ProTrader 7
- VectorVest RealTime Derby Tool
- VectorVest Simulator
- VectorVest Variator
- VectorVest Watchdog
