HOT TOPICS LIST
- MACD
- Fibonacci
- RSI
- Gann
- ADXR
- Stochastics
- Volume
- Triangles
- Futures
- Cycles
- Volatility
- ZIGZAG
- MESA
- Retracement
- Aroon
INDICATORS LIST
LIST OF TOPICS
PRINT THIS ARTICLE
by Ron Walker
Over the years, candlestick patterns have proven to be a reliable source of information, giving advanced warning when reversals were about to transpire. Candlesticks have many strong patterns, but it was the three white soldiers pattern that battled against the bears during this last go-round. And it is the three white soldiers that are now leading the bulls to a victorious charge.
Position: N/A
Ron Walker
Ron Walker is an active trader and technical analyst. He operates an educational website dedicated to the study of Technical Analysis. The website offers free market analysis with daily video presentations and written commentaries. Ron is a video pioneer, being one of the first to utilize the internet producing Technical Analysis videos. His website is thechartpatterntrader.com
PRINT THIS ARTICLE
CANDLESTICK CHARTING
Three White Soldier Candlesticks For S&P 500
12/11/08 11:28:37 AMby Ron Walker
Over the years, candlestick patterns have proven to be a reliable source of information, giving advanced warning when reversals were about to transpire. Candlesticks have many strong patterns, but it was the three white soldiers pattern that battled against the bears during this last go-round. And it is the three white soldiers that are now leading the bulls to a victorious charge.
Position: N/A
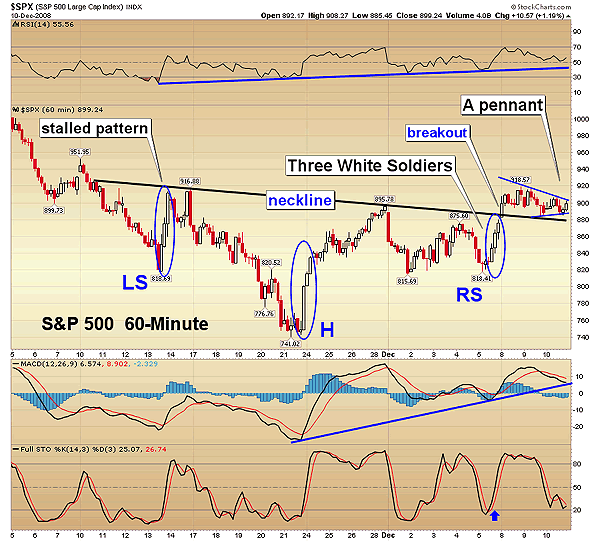
| In Figure 1, the Standard & Poor's 500 hourly chart has been carving out a inverse head & reversal pattern for the better part of November and into December. During the construction of that chart pattern, three white soldiers candlestick patterns continue to appear frequently on the hourly price chart, marking points where buyers came in dining on a feast of accumulation. Note in Figure 1 how that each major reversal point in the pattern got a bullish three white soldiers pattern on the hourly chart. The pattern marked the reversal points in both shoulders and the head in the inverse head & shoulders pattern. |

|
| FIGURE 1: SPX, HOURLY. Here, a three white soldiers reversal allowed both shoulders and the head on this inverse head & shoulders pattern to form (see the blue ovals). A three white soldiers pattern only occurs in a downtrend, because there has to be a downtrend to reverse in order for the pattern to appear. |
| Graphic provided by: StockCharts.com. |
| |
| A three white soldiers candle pattern is a bullish pattern that sports consecutively higher closes on three consecutive price bars, which closes at or near their high prices. But each opening bar should open within the previous body. The pattern resembles a staircase, with each price bar representing a step. In the final stages of the chart pattern, a three white soldiers pattern appeared once again to complete the right shoulder. This event led to the breakout of the inverse head & shoulders pattern the following session on December 8 (Figure 1). |

|
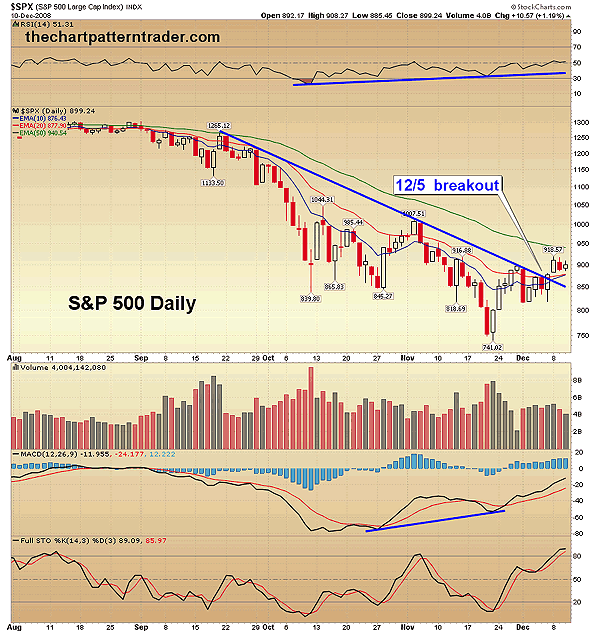
| FIGURE 2: SPX, DAILY. The S&P 500 got its breakout on the daily chart on December 5, 2008, the very day that a bullish three white soldiers pattern appeared on the 60-minute chart on the S&P 500. Note where the trendline comes into play, prices could throw back and test the trendline. |
| Graphic provided by: StockCharts.com. |
| |
| In Figure 1, you'll note that on December 1, the hourly chart put in a higher low of 815, which was successfully tested right before the three white soldiers pattern appeared. This very pattern on the 60-minute chart presided over the death of the intermediate downward trend on the daily chart on December 5, as prices broke above it. In the following session, the inverse head & shoulders pattern broke out in the 60-minute time frame as prices gapped up at the beginning of the session. That move brought about the follow-through needed on the daily chart (Figure 2) to pronounce the bears dead on arrival. The three white soldiers pattern knocked out two birds with one stone by annihilating the intermediate downward trendline on the daily chart and breaking above overhead resistance with the breakout of the inverse head & shoulders pattern on the hourly chart. A culmination of all these efforts combined has rendered the bears impotent for the movement as the three white soldiers pattern proves itself to be a reliable reversal pattern. |
| The measurement of the pattern is arrived by subtracting the lowest point in the head of the pattern from the highest point of the pattern, and then taking the difference and adding it on to the imaginary horizontal neckline that connects the dots of each peak made in the pattern. In this example, the horizontal neckline is slightly sloping downward, so that the breakout point is lower than the highest peak of the pattern near the 880 level. Slanting necklines are very common behavior with this pattern. By taking the measurement and then adding it to the breakout point, we get an objective target for the pattern. The math on the S&P 500 hourly chart in Figure 1 looks like this: 916 (highest peak) - 741 ( lowest low in the head) = 175 points 175 points + 880 (breakout point) = 1055 (objective target) |
| The head & shoulders bottom is now in backtest mode as prices have fallen back to the neckline. During this throwback, prices have taken an brief excursion sideways, forming a continuation pattern in the form of a pennant. If the pennant breaks to the upside, the advance will resume and go on to make higher highs. But should prices continue to experience congestion at the neckline, the bears might be able to gum up the advance momentarily and push prices back down to fill the gap, or prices could even backtest the broken intermediate trendline, sifting down to the 850 level (see Figure 2). Regardless if the pennant breaks out or breaks down, I still believe at the end of the day that the hourly chart will be successful in putting in another higher low. It is technically important that the last minor low hold up at 818 because the building blocks of a successful trend is higher highs and higher lows. Prices may bounce once the moving average convergence/divergence (MACD) (12, 26, 9) touches its rising trendlilne again on the hourly chart. The three white soldiers pattern has reinvented the rally that began off the late November low. This renegade rally will continue to stoke buyers once prices begin their ascension higher again. Just a few short weeks ago, it looked like the S&P 500 was going down in flames, but now, for the time being, from a technical standpoint, the reversal is a foregone conclusion. |
Ron Walker is an active trader and technical analyst. He operates an educational website dedicated to the study of Technical Analysis. The website offers free market analysis with daily video presentations and written commentaries. Ron is a video pioneer, being one of the first to utilize the internet producing Technical Analysis videos. His website is thechartpatterntrader.com
| Website: | thechartpatterntrader.com |
| E-mail address: | thechartpatterntrader@gmail.com |
Click here for more information about our publications!
Comments
Date: 12/16/08Rank: 3Comment:
Date: 12/29/08Rank: 5Comment:
Date: 12/30/08Rank: 5Comment: Thank you. Ron puts together in a very clear and well-written fashion the relationships between a number of essential factors in the technicals and the market in a way which I can understand without experiencing pain in my head. Knock on wood!!

Request Information From Our Sponsors
- StockCharts.com, Inc.
- Candle Patterns
- Candlestick Charting Explained
- Intermarket Technical Analysis
- John Murphy on Chart Analysis
- John Murphy's Chart Pattern Recognition
- John Murphy's Market Message
- MurphyExplainsMarketAnalysis-Intermarket Analysis
- MurphyExplainsMarketAnalysis-Visual Analysis
- StockCharts.com
- Technical Analysis of the Financial Markets
- The Visual Investor
- VectorVest, Inc.
- Executive Premier Workshop
- One-Day Options Course
- OptionsPro
- Retirement Income Workshop
- Sure-Fire Trading Systems (VectorVest, Inc.)
- Trading as a Business Workshop
- VectorVest 7 EOD
- VectorVest 7 RealTime/IntraDay
- VectorVest AutoTester
- VectorVest Educational Services
- VectorVest OnLine
- VectorVest Options Analyzer
- VectorVest ProGraphics v6.0
- VectorVest ProTrader 7
- VectorVest RealTime Derby Tool
- VectorVest Simulator
- VectorVest Variator
- VectorVest Watchdog
