HOT TOPICS LIST
- MACD
- Fibonacci
- RSI
- Gann
- ADXR
- Stochastics
- Volume
- Triangles
- Futures
- Cycles
- Volatility
- ZIGZAG
- MESA
- Retracement
- Aroon
INDICATORS LIST
LIST OF TOPICS
PRINT THIS ARTICLE
by Donald W. Pendergast, Jr.
Gold and silver mining shares are now leading the markets in terms of 13-week relative strength. DRDGold Ltd. appears to be forming an Elliott third wave, which may carry this stock significantly higher.
Position: Accumulate
Donald W. Pendergast, Jr.
Donald W. Pendergast is a financial markets consultant who offers specialized services to stock brokers and high net worth individuals who seek a better bottom line for their portfolios.
PRINT THIS ARTICLE
ELLIOTT WAVE
Elliott Third Wave In Progress For DROOY
12/11/08 02:07:30 PMby Donald W. Pendergast, Jr.
Gold and silver mining shares are now leading the markets in terms of 13-week relative strength. DRDGold Ltd. appears to be forming an Elliott third wave, which may carry this stock significantly higher.
Position: Accumulate
| The AMEX Gold Bugs index (HUI) and the Philadelphia Gold and Silver index ($XAU) both continue to grind higher; gold futures were up about $35, and stock investors wasted no time, continuing to boost prices across the board in the gold/silver mining complex. |

|
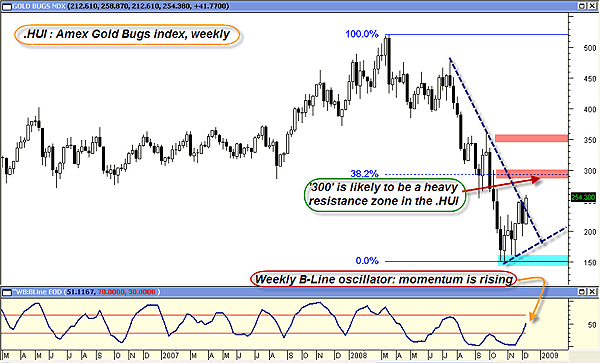
| FIGURE 1: HUI, WEEKLY. Rising momentum propels the Amex Gold Bugs index through a significant resistance trendline. |
| Graphic provided by: MetaStock. |
| Graphic provided by: WB:EOD B-Line from ProfitTrader for MetaStock. |
| |
| The HUI is early into a corrective rally, one that may be on track to achieve a 38.2% retracement of the March -October 2008 selloff (Figure 1). Given the strong momentum of the B-line oscillator, a move up to that key resistance zone near $300 may be reached sooner rather than later. Having confirmed that the AMEX Gold Bugs index has a powerful weekly momentum in its favor, we should analyze DROOY's weekly graph. |

|
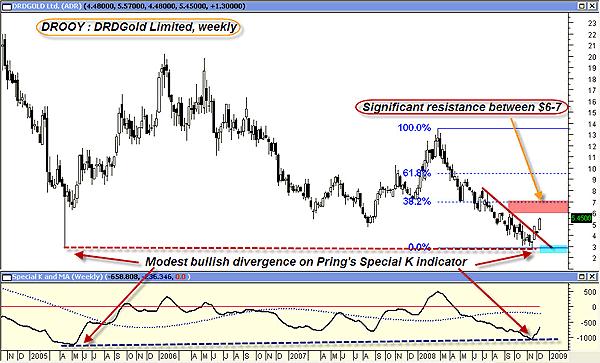
| FIGURE 2: DROOY, WEEKLY. Another strong breakout, but critical resistance resides between $6.00–7.00. |
| Graphic provided by: MetaStock. |
| |
| Although it's not a component stock in either of the gold/silver indexes, DRDGold (DROOY) has extremely high relative strength among gold mining shares, outperforming some of the better-known companies in the gold/silver mining world. DROOY is based in South Africa and has been involved in heavy mining operations for many years. DROOY's weekly chart (Figure 2) highlights the recent wide-range trendline breakout as well as the mildly bullish positive price-momentum divergence on Pring's Special K indicator, a valuable momentum/rate of change tool. DROOY's first significant overhead resistance is near $6.00; if that is cleared, expect a move toward $7.00, which is the 38.2% retracement of the huge selloff. |

|
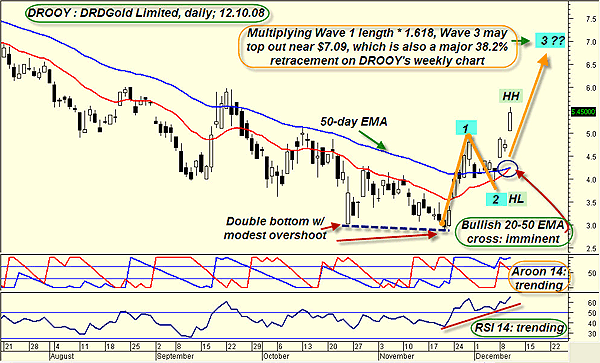
| FIGURE 3: DROOY, DAILY. An Elliott wave 3 in progress; Fibonacci ratios are an integral component of successful Elliott price target forecasts. |
| Graphic provided by: MetaStock. |
| |
| DROOY's daily chart (Figure 3) is even more interesting; a unique blend of technical measurements are suggesting that DROOY is right in the middle of a powerful Elliott wave 3, one of the strongest impulsive wave setups in an equity-based setting. Look at the evidence: DROOY printed a double bottom, then staged a very strong breakout, which took it well above the 50-day exponential moving average (EMA). Price retraced back toward the 50-day EMA before rocketing higher, gapping up twice in the process of doing so. At this point, the stock has established a higher high/higher low (HL and HH on the chart) and appears to be on the verge of a bullish 20- to 50-day EMA crossover (red 20-day EMA line curling higher, ready to pierce the blue 50-day EMA line). Given the fact that DROOY's weekly chart has strong upward B-line momentum and the compelling visual structure of the bottoming/breakout/continuation moves on the daily chart, I see no reason why this couldn't be the start of an Elliott wave 3. Elliotticians know that wave 3 is never the shortest wave in a valid five-wave structure; in fact, in equities, wave 3 is normally the longest wave in the series. They also know that multiplying wave 1's length by either 1.00, 1.618, or 2.618 is the best method of forecasting the eventual price target for wave 3; I've taken the liberty of using a 1.618 multiplier, as price is already very close to providing equality between wave 1 and the current wave 3, even as momentum continues to rise on the stock's weekly chart. Using that 1.618 multiplier provides us with an estimated price target of $7.09 for wave 3, which also happens to coincide with a major Fibonacci 38.2% retracement on DROOY's weekly chart. Again, the stock will need to clear resistance at $6.00 before that price target can be achieved, but if $6.00 is taken out soon on heavy volume/wide range, I expect a rapid move toward $7.00. There are two other indicators that confirm the strength of DROOY's recent updraft; the Aroon 14 says we're in a strong trend phase, agreeing with the equally strong relative strength index (RSI)(14) that this is a major move in process for DROOY. Given the excellent forecasting ability afforded by thoughtful Elliott wave analysis, the entire technical picture is one of extreme bullish sentiment in DROOY. How might a savvy trader play this current strength? Well, if price does reach $6.90-7.10 and then pulls back, forming a valid wave 4, consider a breakout entry in anticipation of a wave 5 move higher of approximately $1.75-1.95, especially if that weekly B-Line keeps cranking higher. Or, if you're the impatient type, consider drilling down to a 15- to 30-minute chart and try to play the developing wave 3 strength afforded by the daily chart. The possibilities are limited only by your imagination, intuition, and account size. |
| Does Elliott wave theory guarantee that certain price targets will be reached within a certain time span? No, nor does any other technical analysis method. However, when a favorable confluence of multiple time frame cycle/momentum dynamics, support/resistance, and trend confirmations all combine to produce a high-probability trade setup, the coincident existence of a valid Elliott wave progression should be enough to get you excited. When applied wisely, Elliott wave can be a superior forecasting tool and it's a wonderful complement to whatever analysis technique you normally rely on. |
Donald W. Pendergast is a financial markets consultant who offers specialized services to stock brokers and high net worth individuals who seek a better bottom line for their portfolios.
| Title: | Writer, market consultant |
| Company: | Linear Trading Systems LLC |
| Jacksonville, FL 32217 | |
| Phone # for sales: | 904-239-9564 |
| E-mail address: | lineartradingsys@gmail.com |
Traders' Resource Links | |
| Linear Trading Systems LLC has not added any product or service information to TRADERS' RESOURCE. | |
Click here for more information about our publications!
Comments
Date: 12/16/08Rank: 3Comment:
Date: 12/16/08Rank: 5Comment:

Request Information From Our Sponsors
- StockCharts.com, Inc.
- Candle Patterns
- Candlestick Charting Explained
- Intermarket Technical Analysis
- John Murphy on Chart Analysis
- John Murphy's Chart Pattern Recognition
- John Murphy's Market Message
- MurphyExplainsMarketAnalysis-Intermarket Analysis
- MurphyExplainsMarketAnalysis-Visual Analysis
- StockCharts.com
- Technical Analysis of the Financial Markets
- The Visual Investor
- VectorVest, Inc.
- Executive Premier Workshop
- One-Day Options Course
- OptionsPro
- Retirement Income Workshop
- Sure-Fire Trading Systems (VectorVest, Inc.)
- Trading as a Business Workshop
- VectorVest 7 EOD
- VectorVest 7 RealTime/IntraDay
- VectorVest AutoTester
- VectorVest Educational Services
- VectorVest OnLine
- VectorVest Options Analyzer
- VectorVest ProGraphics v6.0
- VectorVest ProTrader 7
- VectorVest RealTime Derby Tool
- VectorVest Simulator
- VectorVest Variator
- VectorVest Watchdog
