HOT TOPICS LIST
- MACD
- Fibonacci
- RSI
- Gann
- ADXR
- Stochastics
- Volume
- Triangles
- Futures
- Cycles
- Volatility
- ZIGZAG
- MESA
- Retracement
- Aroon
INDICATORS LIST
LIST OF TOPICS
PRINT THIS ARTICLE
by Donald W. Pendergast, Jr.
Aqua America, one of the strongest stocks in one of the strongest industry groups, is getting close to a buy setup as it pulls back in a strong uptrend.
Position: Hold
Donald W. Pendergast, Jr.
Donald W. Pendergast is a financial markets consultant who offers specialized services to stock brokers and high net worth individuals who seek a better bottom line for their portfolios.
PRINT THIS ARTICLE
CYCLES
Aqua America Close To A Buy?
12/10/08 09:06:05 AMby Donald W. Pendergast, Jr.
Aqua America, one of the strongest stocks in one of the strongest industry groups, is getting close to a buy setup as it pulls back in a strong uptrend.
Position: Hold
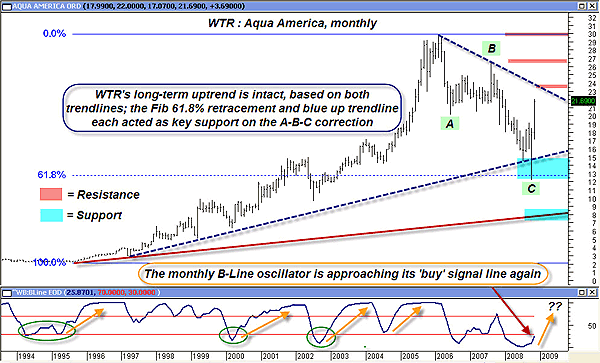
| The Dow Jones US Water index has been outperforming the broad market, up by more than 16% in the last three months. Some analysts believe that water will become one of the most important natural resource issues of the early 21st century as developing countries continue to modernize their infrastructures. As the population of the planet continues to grow, ever-increasing demands are also being placed on the existing sources of fresh water. Whether this means investment opportunities over the long-haul remains to be seen; in any case, right now at least one stock in this industry group appears to be getting close to a buy signal. Figure 1 gives us a clearer view of the long-term trend in Aqua America (WTR). |

|
| FIGURE 1: WTR, MONTHLY. Who said geometry wasn't fun? A combination of Fibonacci 61.8% retracement and a long-term uptrend line each acted as strong support as price rocketed higher. |
| Graphic provided by: MetaStock. |
| Graphic provided by: WB B-Line EOD from ProfitTrader for MetaStock. |
| |
| Based on simple geometry, it's clear that WTR's long-term uptrend is intact. The stock has had quite a run since the mid-1990s, peaking out just shy of $30 in early 2006. Since then, the stock has traced out a fairly clean A-B-C corrective pattern that may have just completed. WTR has rocketed higher since November 2008, up by more than 70% since it reversed near a major Fibonacci support, the 61.8% retracement level at $13. The blue uptrend line also acted as strong support, and price has so far respected both of those important technical barriers. The blue rectangular areas represent the most significant support zones, just as the red rectangles depict the most critical resistance levels; if WTR can garner a monthly close above the blue downtrend line near $23.50 along with a confirmed B-line cross of its buy signal line, a trip up to $26.50 isn't out of the question. Note how accurate the B-line has already been at calling significant turns in this stock. Typically, once it crosses its signal line, the B-line will move to at least the opposite signal line, sometimes higher. A monthly trend confirmation is only one aspect of this trade setup, so now let's look at WTR's daily chart (Figure 2), hoping to pinpoint a more precise area for a possible long entry. |

|
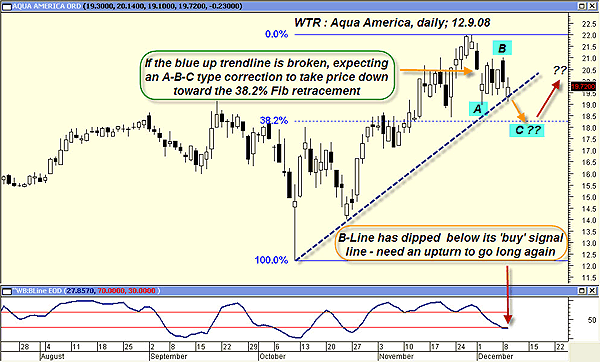
| FIGURE 2: WTR, DAILY. A break below the blue uptrend line implies a continuation of the corrective process. An upturn and confirmed B-line cross above its signal line would be bullish if price is near $18.00–18.75. |
| Graphic provided by: MetaStock. |
| Graphic provided by: WB:B-Line EOD from ProfitTrader for MetaStock. |
| |
| Looking at the daily chart, and it's little wonder why this is one of the highest relative strength stocks versus the Standard & Poor's 500. Even the strongest stocks retrace a portion of their previous gains, and Aqua America is no exception. WTR is currently sitting just above its uptrend line, and at a critical point inasmuch as a break of the trendline implies that a full-sized A-B-C corrective pattern may be in the cards. If it breaks, expect at least a move down toward the Fibonacci 38.2% retracement, which also coincides with a fairly strong area of support between $18.00–18.50. If that support zone holds and the B-line oscillator can complete a confirmed daily crossing of its signal line, the odds favor a continuation of WTR's daily uptrend, especially given the monster momentum it already has going for itself on the monthly chart. If the stock does provide a confirmed entry signal, what then? One way to play this might be to enter on a buy-stop above the price bar that coincides with a confirmed B-line crossing, trailing the position with a three-bar trailing stop of the lows. If the prior high near $22 is hit, perhaps consider taking profits on half the position, trailing the rest for as long as that monthly B-line keeps on rising. If it keeps on rising, that is. Partially complete trade setups are dynamic in nature, and what looks like a perfect setup today can easily morph into an "I've changed my mind" by tomorrow. The key is to keep up to date with every nuance of the stocks and commodities that you choose to follow — become an expert in just a few markets, and you may be surprised at how much better your trading results become. |
| A combination of intriguing long-term fundamentals, well-established uptrends, and high relative strength have all joined forces to make WTR one of the most interesting stocks in the US equity market. All it needs now is a confirmed buy signal on its daily chart, leaving shrewd traders with the job of managing such a trade entry. |
Donald W. Pendergast is a financial markets consultant who offers specialized services to stock brokers and high net worth individuals who seek a better bottom line for their portfolios.
| Title: | Writer, market consultant |
| Company: | Linear Trading Systems LLC |
| Jacksonville, FL 32217 | |
| Phone # for sales: | 904-239-9564 |
| E-mail address: | lineartradingsys@gmail.com |
Traders' Resource Links | |
| Linear Trading Systems LLC has not added any product or service information to TRADERS' RESOURCE. | |
Click here for more information about our publications!
Comments
Date: 12/16/08Rank: 2Comment:

Request Information From Our Sponsors
- VectorVest, Inc.
- Executive Premier Workshop
- One-Day Options Course
- OptionsPro
- Retirement Income Workshop
- Sure-Fire Trading Systems (VectorVest, Inc.)
- Trading as a Business Workshop
- VectorVest 7 EOD
- VectorVest 7 RealTime/IntraDay
- VectorVest AutoTester
- VectorVest Educational Services
- VectorVest OnLine
- VectorVest Options Analyzer
- VectorVest ProGraphics v6.0
- VectorVest ProTrader 7
- VectorVest RealTime Derby Tool
- VectorVest Simulator
- VectorVest Variator
- VectorVest Watchdog
- StockCharts.com, Inc.
- Candle Patterns
- Candlestick Charting Explained
- Intermarket Technical Analysis
- John Murphy on Chart Analysis
- John Murphy's Chart Pattern Recognition
- John Murphy's Market Message
- MurphyExplainsMarketAnalysis-Intermarket Analysis
- MurphyExplainsMarketAnalysis-Visual Analysis
- StockCharts.com
- Technical Analysis of the Financial Markets
- The Visual Investor
