HOT TOPICS LIST
- MACD
- Fibonacci
- RSI
- Gann
- ADXR
- Stochastics
- Volume
- Triangles
- Futures
- Cycles
- Volatility
- ZIGZAG
- MESA
- Retracement
- Aroon
INDICATORS LIST
LIST OF TOPICS
PRINT THIS ARTICLE
by Donald W. Pendergast, Jr.
With gold stocks moving higher again, Newmont Mining, one of the the world's mining giants, is signaling a daily-based swing trade, a setup enhanced by a rising weekly price cycle.
Position: Buy
Donald W. Pendergast, Jr.
Donald W. Pendergast is a financial markets consultant who offers specialized services to stock brokers and high net worth individuals who seek a better bottom line for their portfolios.
PRINT THIS ARTICLE
RISING TREND
Newmont Mining: A Rising Weekly Cycle
12/10/08 08:53:14 AMby Donald W. Pendergast, Jr.
With gold stocks moving higher again, Newmont Mining, one of the the world's mining giants, is signaling a daily-based swing trade, a setup enhanced by a rising weekly price cycle.
Position: Buy
| From July 2008 through October 2008, Newmont Mining (NEM) fell right alongside the rest of the gold/silver mining equities, the big names that populate the Philadelphia Gold & Silver Index and the AMEX Gold Bugs index. Currently trading near $31.40, NEM has recovered, tracing out a series of higher highs and higher lows on its daily chart, just like the rest of the major gold/silver miners. To get a better grip on the technical health of Newmont, let's glance at its weekly chart before deciding how to consider a promising daily trade setup. |

|
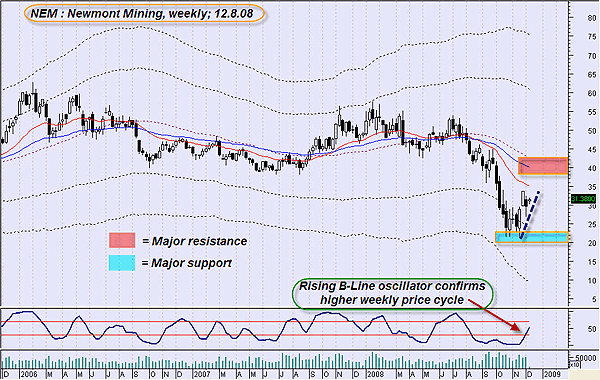
| FIGURE 1: NEM, WEEKLY. A tentative uptrend is confirmed by the rising weekly price cycle. |
| Graphic provided by: MetaStock. |
| Graphic provided by: WB EOD B-Line from ProfitTrader for MetaStock. |
| |
| NEM's weekly graph (Figure 1) depicts the sharp, multiweek selloff, one that, for the time being, appears to have completed. The B-line oscillator, a valuable cycle strength confirmation tool, has already crossed its signal line, rather surprising after such a major selloff. Of course, as this is a countertrend move, expect plenty of overhead resistance. The red rectangle is where the heaviest initial resistance should be encountered if NEM continues higher. Given that the B-line appears to have room to run (and when it crosses a signal line on a closing basis, it typically will carry to at least the opposite signal line) and that the red zone is about $6 above its current price, studying the daily chart would be advisable. In doing such an analysis, we may be able to locate a swing trade setup, one that might be able to capitalize on the higher time frame's momentum. |

|
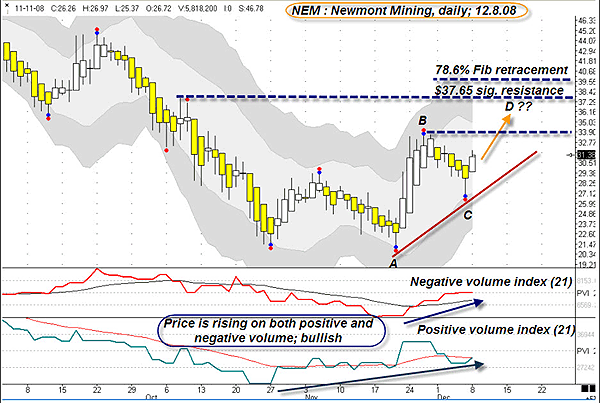
| FIGURE 2: NEM, DAILY. When the negative and positive volume indexes are moving in the same direction, it's easier to confirm a trending move. |
| Graphic provided by: Ensign Windows. |
| |
| The daily chart of Newmont is offering a swing trade setup, one with a decent risk-reward ratio, especially in light of the weekly chart's upward cycle trend (Figure 2). The positive volume index (PVI) and negative volume index (NVI), using a 21-period exponential moving average (EMA) on each, are confirming that NEM is rising on days of negative (lower) volume as well as as on days of positive (higher) volume. The trend pattern of the NVI and PVI is also bullish. NEM has also printed a higher low/higher high, establishing a solid uptrend line (red line) in the process. Overhead, if NEM can barrel through resistance at point B, the next key barrier is a prior high (which is also a Fibonacci 61.8% retracement) near $37.65. Using a simple AB=CD swing calculation, the anticipated CD swing might carry NEM up to $39.35, which is also adjacent to the Fibonacci 78.6% retracement. That's the most optimistic price target, but since there are two preceding significant resistance zones, here's a more conservative way to play a move higher in NEM. |
| Place a buy-stop order at $31.89 and, if filled, an initial stop-loss at $29.50, which is about 17 cents below the recent gap. If price rises, phase in a trailing stop (a three-period moving average of the lows is one idea to consider) and if $33.72 is hit, take a third of the position off at a profit. Continue to trail the remaining shares, taking half of the existing position off if $37.65 is reached. Tighten the stop to a two-bar trailing stop of the lows at that point, letting the rest ride until the final stopout. Of course, there are many ways a trader could play an anticipated move, but that's one style of trading plan to consider. |
| When analyzing a swing trade setup, many variables need to be considered, not the least of which is the higher time frame cycle and/or trend, key support/resistance levels and the reward/risk ratio of the trade. Making sure you're trading in the direction of the general broad market and/or industry group trend is also a major plus, especially if the stocks or commodities you trade are closely correlated to such indexes or industry groups. In this case, NEM appears to be firing on all cylinders, and the final outcome of such a trade setup is highly dependent on the trade management skills of the trader. |
Donald W. Pendergast is a financial markets consultant who offers specialized services to stock brokers and high net worth individuals who seek a better bottom line for their portfolios.
| Title: | Writer, market consultant |
| Company: | Linear Trading Systems LLC |
| Jacksonville, FL 32217 | |
| Phone # for sales: | 904-239-9564 |
| E-mail address: | lineartradingsys@gmail.com |
Traders' Resource Links | |
| Linear Trading Systems LLC has not added any product or service information to TRADERS' RESOURCE. | |
Click here for more information about our publications!
Comments
Date: 12/16/08Rank: 5Comment:

Request Information From Our Sponsors
- VectorVest, Inc.
- Executive Premier Workshop
- One-Day Options Course
- OptionsPro
- Retirement Income Workshop
- Sure-Fire Trading Systems (VectorVest, Inc.)
- Trading as a Business Workshop
- VectorVest 7 EOD
- VectorVest 7 RealTime/IntraDay
- VectorVest AutoTester
- VectorVest Educational Services
- VectorVest OnLine
- VectorVest Options Analyzer
- VectorVest ProGraphics v6.0
- VectorVest ProTrader 7
- VectorVest RealTime Derby Tool
- VectorVest Simulator
- VectorVest Variator
- VectorVest Watchdog
- StockCharts.com, Inc.
- Candle Patterns
- Candlestick Charting Explained
- Intermarket Technical Analysis
- John Murphy on Chart Analysis
- John Murphy's Chart Pattern Recognition
- John Murphy's Market Message
- MurphyExplainsMarketAnalysis-Intermarket Analysis
- MurphyExplainsMarketAnalysis-Visual Analysis
- StockCharts.com
- Technical Analysis of the Financial Markets
- The Visual Investor
