HOT TOPICS LIST
- MACD
- Fibonacci
- RSI
- Gann
- ADXR
- Stochastics
- Volume
- Triangles
- Futures
- Cycles
- Volatility
- ZIGZAG
- MESA
- Retracement
- Aroon
INDICATORS LIST
LIST OF TOPICS
PRINT THIS ARTICLE
by Donald W. Pendergast, Jr.
Here's a look at Odyssey Re Holdings, the strongest stock in the strongest industry group compared with the New York Composite Index.
Position: Hold
Donald W. Pendergast, Jr.
Donald W. Pendergast is a financial markets consultant who offers specialized services to stock brokers and high net worth individuals who seek a better bottom line for their portfolios.
PRINT THIS ARTICLE
REL. STR COMPARATIVE
ORH: Superior Relative Strength Vs. Broad Market
12/09/08 09:47:15 AMby Donald W. Pendergast, Jr.
Here's a look at Odyssey Re Holdings, the strongest stock in the strongest industry group compared with the New York Composite Index.
Position: Hold
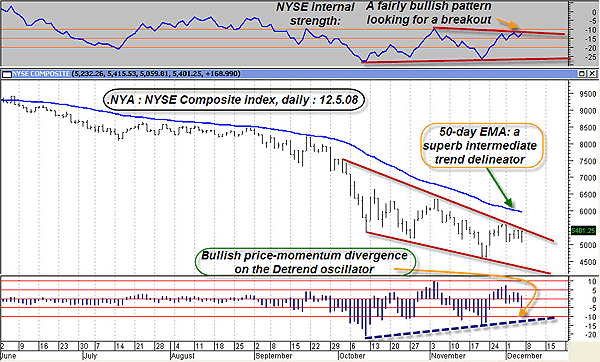
| Even in a declining market trend, some industry groups tend to outperform the broad market. The broad US markets are best represented by the New York Composite index (NYA), which is a far more meaningful barometer of the market's health than say, the Dow Jones Industrial Average (DJIA), which tracks only 30 large-cap stocks. After nearly 14 months of selloffs, the NYA has developed a pattern on its daily chart that may be signaling that the worst of the declines are over (for now) and that an upside breakout may be the eventual outcome. See Figure 1. |

|
| FIGURE 1: NYSE COMPOSITE, DAILY. Here are positive price-momentum divergence, an ending diagonal pattern, and strengthening market internals. |
| Graphic provided by: MetaStock. |
| Graphic provided by: WB EOD Detrend from ProfitTrader for MetaStock. |
| |
| For the last two months, the NYA has been slowly forming a diagonal pattern that, along with bullish price-momentum divergences on the detrend oscillator and the internal strength indicator (composed of a weighted mix of the advance-decline, new high/new low, up/down volume, and rate of change calculations), implies that an upside breakout is the most likely path for price to follow. Regardless of how the pattern plays out, volatility has definitely declined as the market has begun to discount each new round of disappointing economic news. For example, a few days ago the unemployment report revealed that more than a half-million Americans were handed their walking papers last month, one of the worst months on record for this vital economic statistic. The market actually went up a few percentage points that day, completely shrugging off the negative news. While that behavior doesn't guarantee that the market will rally soon, it is interesting to note that the broad markets generally bottom nine to 12 months before the economy does after having already discounted all of the bad news going forward. Right now, the Dow Jones US Reinsurance index (Figure 2) has the greatest 13-week relative strength of any industry group versus the NYA, so let's see how the chart patterns compare. |

|
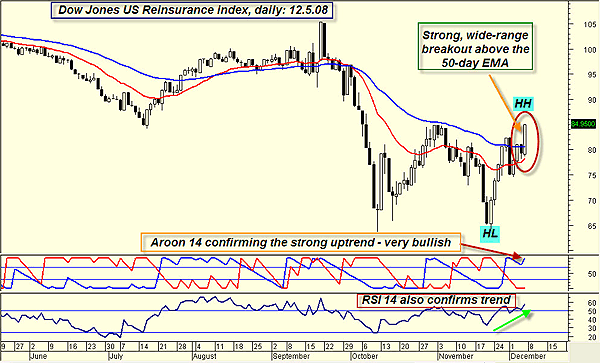
| FIGURE 2: DJ REINSURANCE INDEX, DAILY. A variety of technicals confirm the emerging uptrend in this industry group. |
| Graphic provided by: MetaStock. |
| |
| Figure 2 has a nice confluence of bullish clues that imply a continuation of the current trend higher. The primary evidence is the confirmation of a higher low and a higher high (marked as HL and HH on the chart), a wide-range breakout bar that closed above the 50-day exponential moving average (EMA), an Aroon 14 indicator that signifies a strong trend phase is under way and a relative strength index (RSI) 14 that has broken above the 50 level. All in all, this is a compelling image of an emerging, strengthening trend in the Reinsurance index. Can we do a little better than this, perhaps drilling down into the components of this index, maybe locating one of the stronger stocks within it? |

|
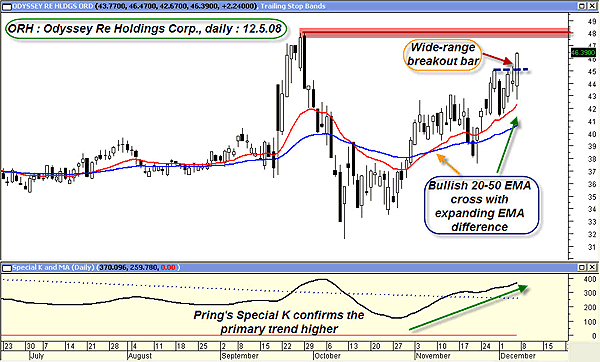
| FIGURE 3: ORH, DAILY. The strongest stock in the DJ US Reinsurance Index powers higher; a test of the previous high at $48 may be next. |
| Graphic provided by: MetaStock. |
| |
| Running a simple relative strength comparison against the Reinsurance index reveals that Odyssey Re Holdings Corp., (ORH) is the prime mover in this group (Figure 3). Odyssey completed its own bullish 20- to 50-day EMA crossover last month, even as Martin Pring's Special K momentum/rate of change indicator confirmed that the stock was in a primary bull trend. Even more bullish, the difference between the two EMAs is expanding, verifying just how strong this stock is. The recent wide range upside breakout also suggests that ORH may have its sights set on the late September 2008 high at $48. Now that we've located one of the hottest stocks in the market, what now? Well, one idea would be to buy on a retracement move if the stock reverses on a failed breakout through $48. Another strategy might be to wait for a successful breakout and close above $48 and then wait for a pullback toward the breakout zone above $48. Confirming the cycle and/or trend strength of ORH's weekly chart would also be a wise idea, should you attempt to board this fast-running equity train. Relative strength analysis is one of the most effective analysis tools available, allowing you to home in on the strongest/weakest industry groups and the strongest/weakest stocks within such groups. |

|
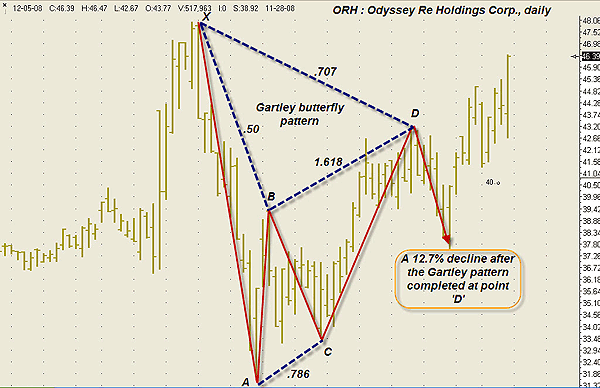
| FIGURE 4: ORH, DAILY. A Gartley butterfly pattern, complete with Fibonacci ratios for each swing. Can you spot the wings? |
| Graphic provided by: Ensign Windows. |
| |
| Just for fun, I've also included an additional daily chart of ORH, one featuring a completed Gartley butterfly pattern (Figure 4). Once you get used to identifying these patterns, you can begin to see how effective they can be at timing short-term reversals once complete. In this instance, ORH dropped 12.7% after pattern completion; it would have been a great swing trade setup on a 60-minute chart. |
Donald W. Pendergast is a financial markets consultant who offers specialized services to stock brokers and high net worth individuals who seek a better bottom line for their portfolios.
| Title: | Writer, market consultant |
| Company: | Linear Trading Systems LLC |
| Jacksonville, FL 32217 | |
| Phone # for sales: | 904-239-9564 |
| E-mail address: | lineartradingsys@gmail.com |
Traders' Resource Links | |
| Linear Trading Systems LLC has not added any product or service information to TRADERS' RESOURCE. | |
Click here for more information about our publications!
PRINT THIS ARTICLE

Request Information From Our Sponsors
- VectorVest, Inc.
- Executive Premier Workshop
- One-Day Options Course
- OptionsPro
- Retirement Income Workshop
- Sure-Fire Trading Systems (VectorVest, Inc.)
- Trading as a Business Workshop
- VectorVest 7 EOD
- VectorVest 7 RealTime/IntraDay
- VectorVest AutoTester
- VectorVest Educational Services
- VectorVest OnLine
- VectorVest Options Analyzer
- VectorVest ProGraphics v6.0
- VectorVest ProTrader 7
- VectorVest RealTime Derby Tool
- VectorVest Simulator
- VectorVest Variator
- VectorVest Watchdog
- StockCharts.com, Inc.
- Candle Patterns
- Candlestick Charting Explained
- Intermarket Technical Analysis
- John Murphy on Chart Analysis
- John Murphy's Chart Pattern Recognition
- John Murphy's Market Message
- MurphyExplainsMarketAnalysis-Intermarket Analysis
- MurphyExplainsMarketAnalysis-Visual Analysis
- StockCharts.com
- Technical Analysis of the Financial Markets
- The Visual Investor
