

HOT TOPICS LIST
- MACD
- Fibonacci
- RSI
- Gann
- ADXR
- Stochastics
- Volume
- Triangles
- Futures
- Cycles
- Volatility
- ZIGZAG
- MESA
- Retracement
- Aroon
INDICATORS LIST
LIST OF TOPICS
PRINT THIS ARTICLE
by Chaitali Mohile
Kensey Nash has been in a robust downtrend for more than three months. Will the oversold stock resume the bullish rally, or is it forming a strong bottom?
Position: N/A
Chaitali Mohile
Active trader in the Indian stock markets since 2003 and a full-time writer. Trading is largely based upon technical analysis.
PRINT THIS ARTICLE
CHART ANALYSIS
Is Kensey Nash Ready To Surge?
12/08/08 10:04:57 AMby Chaitali Mohile
Kensey Nash has been in a robust downtrend for more than three months. Will the oversold stock resume the bullish rally, or is it forming a strong bottom?
Position: N/A
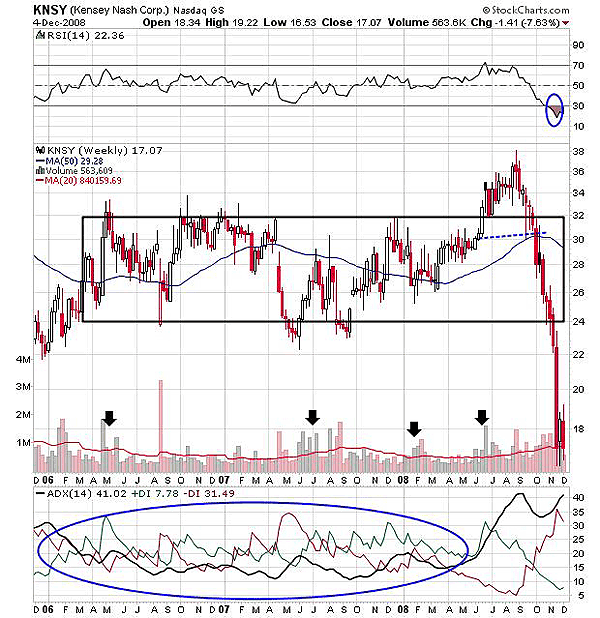
| The stock value of Kensey Nash Corp. (KNSY) in August 2008 was 38 and by end of November the value had slipped to 17. But KNSY was not the only stock that declined during the market mayhem. Technically, KNSY had volatile rallies since 2006. According to Figure 1, the rally that began in 2005 entered in a long consolidation phase in 2006, with a wide range of 32–24. The upper and lower shadows, number of red (bearish) candles, and the size of candles as well indicate the volatility during the consolidation. However, every rally from the lower range at 24 was traded with the upper range target. We can see the increase in volume at the 24 level (see the marked arrows) in Figure 1. |
|
| FIGURE 1: KNSY, WEEKLY. The stock took a nosedive. The oversold RSI (14) and the overheated downtrend would result in a bottom formation rather than initiating any fresh rally. |
| Graphic provided by: StockCharts.com. |
| |
| The upper range was breached in July 2008, and the stock rushed to make an all-time high at 38 in September 2008. The average directional movement index (ADX) (14) that indicated a weak trend for the last three years suddenly surged to bullish levels, developing an uptrend. After consolidating for a pretty long period, the stock usually gets fueled for an upside move, but KNSY failed to act accordingly. The uptrend indicated by ADX (14) was overheated, and therefore, the buying pressure declined. As a result, the price value of KNSY slipped from its all-time high, and the bears grew strong. The stock began a downside journey without a single halt. The relative strength index (RSI) (14) also found resistance at overbought levels at 70, indicating a lack of bullish strength to ride the rally. So the price and RSI (14) declined faster than the previous upward rally. |
| Currently, the RSI (14) is oversold at 22, and the ADX (14) shows an overheated downtrend. This situation is favorable for a fresh bullish move. But both the indicators are still not ready for a rally, and we cannot trade in anticipation. The RSI (14) can remain oversold for a longer time frame and it also has enough room for a downside move. In that case, KNSY may retrace to a prior low at 16. The declining overheated downtrend may start a pullback rally from the lower area with the immediate target of 18. As a result, KNSY could move in the range of 16–18 till the confirming uptrend develops, forming the strong bottom. |
|
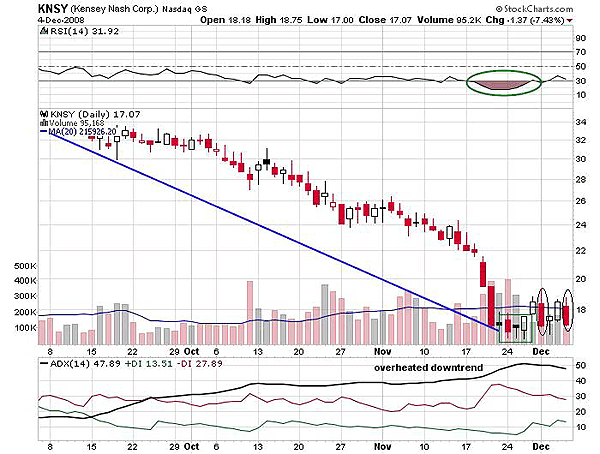
| FIGURE 2: KNSY, DAILY. The marked bearish candles show the weakness. The RSI (14) is unable to move above the oversold area, indicating a lack of bullish strength. |
| Graphic provided by: StockCharts.com. |
| |
| The daily chart (Figure 2) shows KNSY consolidating at the lower level in the range of 16–18. The RSI (14) has been flirting with 30 oversold levels over the past two months, indicating that the stock is likely to bottom out. Currently, the oversold RSI (14) is again tangled at 30 levels and is reluctant to surge to bullish areas. This might generate volatile price action in the range. The downtrend in Figure 2 is highly overheated that can result in declining selling pressure. In addition, the three bearish days (red candles) on the chart have closed near the intraday low, indicating weakness, and the resistance to move higher is indicated by long upper shadows of the candles. |
| KNSY is more likely to form a bottom than any robust bullish rally. I would not recommend any positional trade on the stock. However, KNSY may be bought above 18 with the short-term target of 22 on the confirmed bullish indicators, since the downside is very limited. |
Active trader in the Indian stock markets since 2003 and a full-time writer. Trading is largely based upon technical analysis.
| Company: | Independent |
| Address: | C1/3 Parth Indraprasth Towers. Vastrapur |
| Ahmedabad, Guj 380015 | |
| E-mail address: | chaitalimohile@yahoo.co.in |
Traders' Resource Links | |
| Independent has not added any product or service information to TRADERS' RESOURCE. | |
Click here for more information about our publications!
PRINT THIS ARTICLE

Request Information From Our Sponsors
- VectorVest, Inc.
- Executive Premier Workshop
- One-Day Options Course
- OptionsPro
- Retirement Income Workshop
- Sure-Fire Trading Systems (VectorVest, Inc.)
- Trading as a Business Workshop
- VectorVest 7 EOD
- VectorVest 7 RealTime/IntraDay
- VectorVest AutoTester
- VectorVest Educational Services
- VectorVest OnLine
- VectorVest Options Analyzer
- VectorVest ProGraphics v6.0
- VectorVest ProTrader 7
- VectorVest RealTime Derby Tool
- VectorVest Simulator
- VectorVest Variator
- VectorVest Watchdog
- StockCharts.com, Inc.
- Candle Patterns
- Candlestick Charting Explained
- Intermarket Technical Analysis
- John Murphy on Chart Analysis
- John Murphy's Chart Pattern Recognition
- John Murphy's Market Message
- MurphyExplainsMarketAnalysis-Intermarket Analysis
- MurphyExplainsMarketAnalysis-Visual Analysis
- StockCharts.com
- Technical Analysis of the Financial Markets
- The Visual Investor