HOT TOPICS LIST
- MACD
- Fibonacci
- RSI
- Gann
- ADXR
- Stochastics
- Volume
- Triangles
- Futures
- Cycles
- Volatility
- ZIGZAG
- MESA
- Retracement
- Aroon
INDICATORS LIST
LIST OF TOPICS
PRINT THIS ARTICLE
by Ron Walker
The trendline is the fulcrum of power, and the longer it lingers on a chart, the stronger it becomes. The current intermediate downtrend has proved to be a stumbling block to the bulls time and again over the last couple of months, but a reversal pattern on the SPX may stop the hemorrhaging. This pattern may give the bulls just enough rope to lasso the bears.
Position: N/A
Ron Walker
Ron Walker is an active trader and technical analyst. He operates an educational website dedicated to the study of Technical Analysis. The website offers free market analysis with daily video presentations and written commentaries. Ron is a video pioneer, being one of the first to utilize the internet producing Technical Analysis videos. His website is thechartpatterntrader.com
PRINT THIS ARTICLE
TECHNICAL ANALYSIS
A Trend Is A Trend Until It Isn't
12/08/08 09:53:21 AMby Ron Walker
The trendline is the fulcrum of power, and the longer it lingers on a chart, the stronger it becomes. The current intermediate downtrend has proved to be a stumbling block to the bulls time and again over the last couple of months, but a reversal pattern on the SPX may stop the hemorrhaging. This pattern may give the bulls just enough rope to lasso the bears.
Position: N/A
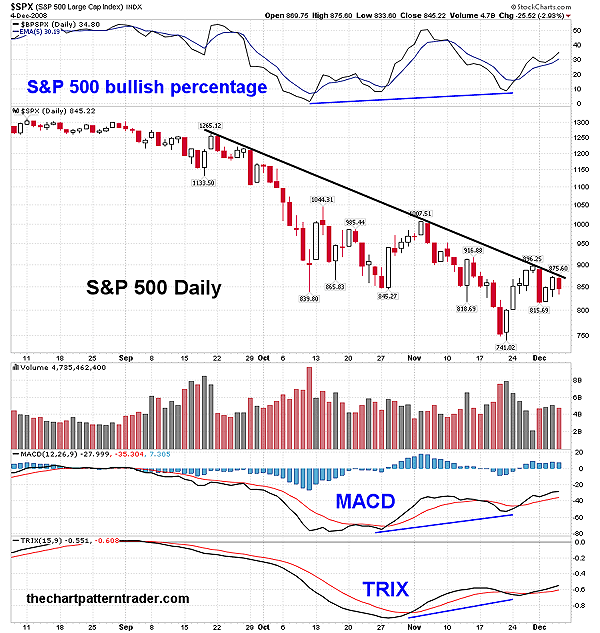
| The market has been captivated by bad news over the last several months, leading to wild prices swings. The increased volatility has produced dicey price movement from choppy moves, creating massive percentage swings. It is during these turbulent price movements that price scaling becomes very important. There are two methods of price scaling, arithmetic and logarithmic. The linear (arithmetic) scale measures the vertical distance at the same rate, no matter what the price level. On a linear scale, the spacing between each point on the vertical axis is equal, whereas on the logarithmic (percentage) scale, the spacing on the vertical axis reflects percentage fluctuations and gives more weight to the more recent prices. The logarithmic scale is also called semilog and is used to gauge price movements in volatile or long-term settings. In Figure 1, the Standard & Poor's 500 daily chart is measured on a logarithmic percentage scale. The chart shows that the S&P 500 has been in a mature downtrend since September. The trendline was recently tested twice during early and late November. After its last test of the trendline on November 28, prices tumbled lower the following session after a reaction occurred off the intermediate trendline. A snapback reaction then carried prices back up, slamming into the trendline once again. |

|
| FIGURE 1: SPX, DAILY. Here, the sharp, distinct downward trendline continues to be an obstruction for the bulls. But the bulls may be mounting to launch another attack against this roadblock, with a bullish MACD and TRIX. The S&P 500 bullish percentage is favorable too, as it remains above its five-day EMA. |
| Graphic provided by: StockCharts.com. |
| |
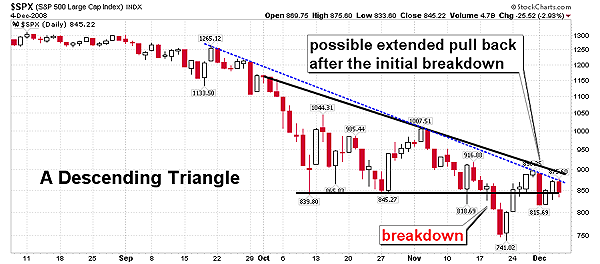
| This intermediate downtrend remains a constant barrier, with each attempt that the bulls have made to propel prices higher (Figure 1) stopping dead in its tracks at the intermediate trendline. There is a chance that prices can break out of this downtrend. Trend-based indicators in Figure 1, such as the moving average convergence/divergence (MACD) and the triple-smoothed exponential moving average (TRIX), have gotten bullish crosses. The MACD got its bullish crossover on November 25 and the trading index (TRIX) turned bullish on November 29. Meanwhile, the S&P 500 bullish percentage continues to be bullish as it remains above the five-day exponential moving average (EMA). But in Figure 2, the S&P 500 still has a disturbing bearish descending triangle on its daily chart that the bulls must contend with, and we still run the risk that this is nothing more than an extended pullback of those bearish patterns. Now, should the bulls regroup and successfully carry prices decisively up and over the declining trendline in a renegade rally, the descending triangle may be negated and the downtrend will lose its authority. |

|
| FIGURE 2: SPX, DAILY. The descending triangle that recently broke down on the S&P 500 is still a formidable foe. There is still a chance that this may be an extended price pullback, taken as a detour before the downward trend reasserts itself. |
| Graphic provided by: StockCharts.com. |
| |
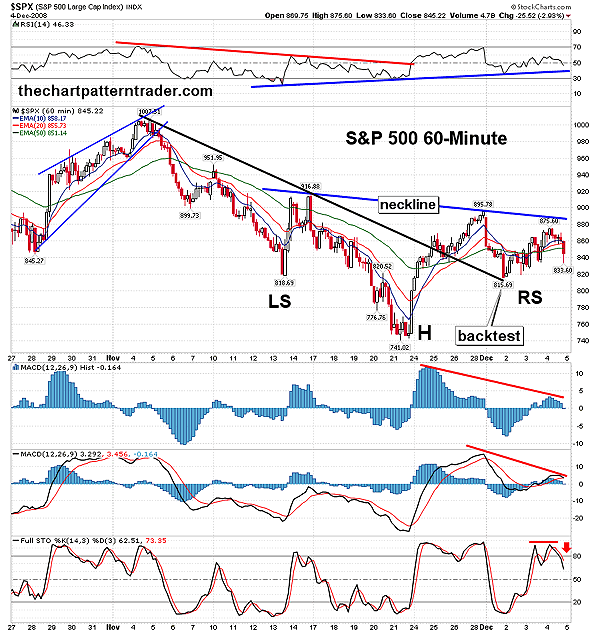
| The S&P 500 recently formed a bullish inverse head & shoulders pattern on its 60-minute chart, which could allow prices to penetrate that declining trendline on its daily chart. The pattern has been forming since mid-November and recently carved out its right shoulder in December. The neckline of the pattern has an angle of descent that would put the pivot point of this pattern near the 885 level. However, there are some problems with this bullish pattern. In Figure 3, the stochastic (14,3, 3) on the hourly chart is showing signs of weakness as prices broke below the value of 80 and are coming off overbought levels. The relative strength index (RSI) still has a rising trend, but should it be breached by sagging prices, then the inverse head & shoulders pattern will suffer a devastating blow and prices will likely retreat lower to test the lows made in late November. |

|
| FIGURE 3: SPX, HOURLY. The hourly chart has a reversal pattern that could break the intermediate downward trend, but the momentum indicators are weakening. The RSI, histogram, and the MACD all put in lower peaks, confirming the one made on the price chart. Note that the last minor low successfully backtested the downtrend off the November highs, which may allow that minor low of 815 to hold up even if prices fall to test it again. |
| Graphic provided by: StockCharts.com. |
| |
| Moreover, the MACD just put in a lower peak and got a bearish crossover while it is hovering just above the zero line. The second clue comes from the slope of the MACD histogram. The slope is defined by the relationship of its last two bars. In Figure 3, we see that the histogram got a lower peak on the SPX's 60-minute chart. Shortly after the peak was made on December 4, the bars drifted lower, moving below the centerline. When the histogram is in the early stages of moving below its centerline, we want to be watching price and the indicator to confirm each other. Prices should put in a series of lower lows following the histogram bars. The histogram's push below the centerline is putting the bullish inverse head & shoulders pattern in jeopardy. But the inverse head & shoulders pattern remains in play as long as prices don't sink below the last trough low that formed the right shoulder at 815. |
| In conclusion, the S&P 500 is moving adjacent to its intermediate trendline on the daily chart as it appears to flirting with the notion of a breakout. Meanwhile, a bullish reversal pattern has formed on the hourly chart, but momentum indicators in that time frame are bleak at least for the short term. If the bulls take action and aggressively push prices above the intermediate downtrend, then the inverse head & shoulders pattern will garner support and have a chance to flourish. A breakout is still possible because the prices are within striking distance of the trendline. But if the bulls fail to take that leap of faith across the trendline, it will allow the bears to chip away at this most recent rally. We can expect another shootout here as the bulls and bears come in with guns blazing at this trendline for a honest-to-goodness old-fashioned showdown. |
Ron Walker is an active trader and technical analyst. He operates an educational website dedicated to the study of Technical Analysis. The website offers free market analysis with daily video presentations and written commentaries. Ron is a video pioneer, being one of the first to utilize the internet producing Technical Analysis videos. His website is thechartpatterntrader.com
| Website: | thechartpatterntrader.com |
| E-mail address: | thechartpatterntrader@gmail.com |
Click here for more information about our publications!
Comments
Date: 12/09/08Rank: 4Comment:

Request Information From Our Sponsors
- VectorVest, Inc.
- Executive Premier Workshop
- One-Day Options Course
- OptionsPro
- Retirement Income Workshop
- Sure-Fire Trading Systems (VectorVest, Inc.)
- Trading as a Business Workshop
- VectorVest 7 EOD
- VectorVest 7 RealTime/IntraDay
- VectorVest AutoTester
- VectorVest Educational Services
- VectorVest OnLine
- VectorVest Options Analyzer
- VectorVest ProGraphics v6.0
- VectorVest ProTrader 7
- VectorVest RealTime Derby Tool
- VectorVest Simulator
- VectorVest Variator
- VectorVest Watchdog
- StockCharts.com, Inc.
- Candle Patterns
- Candlestick Charting Explained
- Intermarket Technical Analysis
- John Murphy on Chart Analysis
- John Murphy's Chart Pattern Recognition
- John Murphy's Market Message
- MurphyExplainsMarketAnalysis-Intermarket Analysis
- MurphyExplainsMarketAnalysis-Visual Analysis
- StockCharts.com
- Technical Analysis of the Financial Markets
- The Visual Investor
