HOT TOPICS LIST
- MACD
- Fibonacci
- RSI
- Gann
- ADXR
- Stochastics
- Volume
- Triangles
- Futures
- Cycles
- Volatility
- ZIGZAG
- MESA
- Retracement
- Aroon
INDICATORS LIST
LIST OF TOPICS
PRINT THIS ARTICLE
by David Penn
Does old-fashioned Dow Theory anticipate a test of the May highs for the Dow Industrials?
Position: N/A
David Penn
Technical Writer for Technical Analysis of STOCKS & COMMODITIES magazine, Working-Money.com, and Traders.com Advantage.
PRINT THIS ARTICLE
TECHNICAL ANALYSIS
Transports' Baby, Industrials Maybe
07/20/01 01:52:24 PMby David Penn
Does old-fashioned Dow Theory anticipate a test of the May highs for the Dow Industrials?
Position: N/A
| Of all the components of Dow Theory, the notion that the "averages must confirm" is probably the most touted as indicative of the applicability (or lack thereof) of traditional Dow Theory to modern markets. By "averages", the Dow Theory suggests that the Dow Industrials Average and the Dow Transportation Average must move, more or less, in tandem. For example, if the transports make a relative new high, then the industrials are expected to make a relative new high. When the averages fail to confirm each other-- for example, when the transports make a new relative low and the industrials hold their ground--a warning signal is sounding that a major market shift may be soon in coming. |
| The logic behind the rationale of the Dow Theory is simple: in a healthy economy, the demand for industrial goods is matched by the need to transport them to customers. Thus, when the industrials are down, the transports are expected to be down as well, and vice versa. The failure to confirm, or the "divergence", when it occurs is indicative that something in this basic equation has gone wrong and the health of the market--in the short term--has become a bit more suspect. |

|
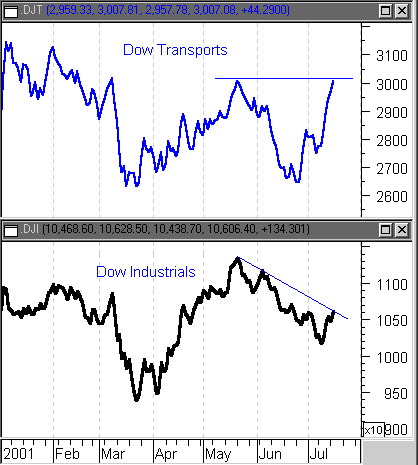
| Figure 1: The Averages Must Confirm ... But does Dow Theory anticipate breakout or resistance failure? |
| Graphic provided by: MetaStock. |
| |
| The most common criticism against this part of Dow Theory is that the transports average was originally based on the railroad average, and that the relationship between today's transports (which include airlines and overnight courier services such as FedEx) and today's industrials is vastly different from the relationship between yesterday's transports and industrials. While this may be the case fundamentally speaking, market technicians have continued to exploit the relationship between the transports and industrials to this day. |
| Since the beginning of the year we see two averages that have indeed moved more or less in tandem: early highs were corrected in March, and a major rally in April peaked in mid-May for both averages. The averages, however, get interesting in June. The transports, which are often thought of as the leading average in the pair, corrected sharply in mid-June, rallied at the beginning of July and then, after a shallow correction, rallied to retest the May highs. The industrials, on the other hand, corrected much less sharply in June (the transports' June correction also served as a test for the spring lows) and the subsequent rally has been relatively anemic, coming nowhere near close to testing the May highs. You can easily tell the difference by looking at the resistance lines drawn on the two charts: the transports chart features a horizontal resistance line, while the Industrials chart features a resistance line that is also a fairly well-established downtrend line. |
| What does this suggest for the Dow Industrials? On first glance, the fact that the transports are testing their May highs is bullish for the industrials, which are trading at their July high (which is below both the June and May highs for the industrials). Generally speaking, a bullish move in the transports can have some carry-over effect into the industrials. However, it is worth nothing that both the transports and the industrials are at resistance points--the transports at horizontal resistance at about 3000 and the industrials at a downtrend resistance line currently at about 10,500. Should both averages fail to penetrate resistance and head back down, then the confirmation of the averages that Dow theorists and market technicians watch for may--albeit bearishly--come to pass. |
Technical Writer for Technical Analysis of STOCKS & COMMODITIES magazine, Working-Money.com, and Traders.com Advantage.
| Title: | Technical Writer |
| Company: | Technical Analysis, Inc. |
| Address: | 4757 California Avenue SW |
| Seattle, WA 98116 | |
| Phone # for sales: | 206 938 0570 |
| Fax: | 206 938 1307 |
| Website: | www.Traders.com |
| E-mail address: | DPenn@traders.com |
Traders' Resource Links | |
| Charting the Stock Market: The Wyckoff Method -- Books | |
| Working-Money.com -- Online Trading Services | |
| Traders.com Advantage -- Online Trading Services | |
| Technical Analysis of Stocks & Commodities -- Publications and Newsletters | |
| Working Money, at Working-Money.com -- Publications and Newsletters | |
| Traders.com Advantage -- Publications and Newsletters | |
| Professional Traders Starter Kit -- Software | |
Click here for more information about our publications!
Comments

Request Information From Our Sponsors
- StockCharts.com, Inc.
- Candle Patterns
- Candlestick Charting Explained
- Intermarket Technical Analysis
- John Murphy on Chart Analysis
- John Murphy's Chart Pattern Recognition
- John Murphy's Market Message
- MurphyExplainsMarketAnalysis-Intermarket Analysis
- MurphyExplainsMarketAnalysis-Visual Analysis
- StockCharts.com
- Technical Analysis of the Financial Markets
- The Visual Investor
- VectorVest, Inc.
- Executive Premier Workshop
- One-Day Options Course
- OptionsPro
- Retirement Income Workshop
- Sure-Fire Trading Systems (VectorVest, Inc.)
- Trading as a Business Workshop
- VectorVest 7 EOD
- VectorVest 7 RealTime/IntraDay
- VectorVest AutoTester
- VectorVest Educational Services
- VectorVest OnLine
- VectorVest Options Analyzer
- VectorVest ProGraphics v6.0
- VectorVest ProTrader 7
- VectorVest RealTime Derby Tool
- VectorVest Simulator
- VectorVest Variator
- VectorVest Watchdog
