HOT TOPICS LIST
- MACD
- Fibonacci
- RSI
- Gann
- ADXR
- Stochastics
- Volume
- Triangles
- Futures
- Cycles
- Volatility
- ZIGZAG
- MESA
- Retracement
- Aroon
INDICATORS LIST
LIST OF TOPICS
PRINT THIS ARTICLE
by James Kupfer
The DJIA and other major equity indexes appear to be forming a bullish RSI divergence.
Position: Accumulate
James Kupfer
Mr. Kupfer is a market professional and amateur stock market commentator. Disclosure: It is likely that Mr. Kupfer has or will enter a position in any security he writes about.
PRINT THIS ARTICLE
RSI
The DJIA's RSI Divergence
12/05/08 09:06:53 AMby James Kupfer
The DJIA and other major equity indexes appear to be forming a bullish RSI divergence.
Position: Accumulate
| The relative strength index (RSI) is a gauge of the strength of a stock's price action. As with many other indicators, the RSI normally matches the price movement of the security that it is being used to analyze. When prices go up, forming higher highs and lower lows, the RSI normally does as well. |
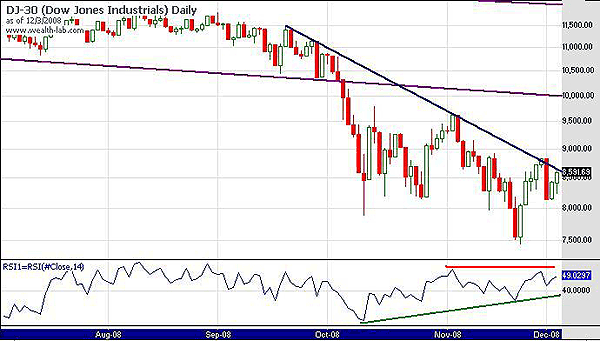
| When the RSI and price diverge, it can be a sign that a stock is stronger or weaker than it might otherwise appear. Such is the case now with the Dow Jones 30 and other major equity markets. The Dow Jones Industrial Average (DJIA) has recently made a series of lower lows, but the RSI is actually moving up. As can be seen in Figure 1, prices are moving down beneath the blue trendline. In the bottom pane, the RSI can be seen to be moving up above the green line. |

|
| FIGURE 1: DJIA, DAILY. The Dow Jones 30 is making new lows while the RSI is moving up. |
| Graphic provided by: Wealth-lab. |
| |
| This bullish divergence is a sign of underlying strength in the market. If the RSI continues to move up, especially if it breaks above the red line at 53, look for prices to follow. |
Mr. Kupfer is a market professional and amateur stock market commentator. Disclosure: It is likely that Mr. Kupfer has or will enter a position in any security he writes about.
Click here for more information about our publications!
Comments
Date: 12/09/08Rank: 4Comment:

Request Information From Our Sponsors
- StockCharts.com, Inc.
- Candle Patterns
- Candlestick Charting Explained
- Intermarket Technical Analysis
- John Murphy on Chart Analysis
- John Murphy's Chart Pattern Recognition
- John Murphy's Market Message
- MurphyExplainsMarketAnalysis-Intermarket Analysis
- MurphyExplainsMarketAnalysis-Visual Analysis
- StockCharts.com
- Technical Analysis of the Financial Markets
- The Visual Investor
- VectorVest, Inc.
- Executive Premier Workshop
- One-Day Options Course
- OptionsPro
- Retirement Income Workshop
- Sure-Fire Trading Systems (VectorVest, Inc.)
- Trading as a Business Workshop
- VectorVest 7 EOD
- VectorVest 7 RealTime/IntraDay
- VectorVest AutoTester
- VectorVest Educational Services
- VectorVest OnLine
- VectorVest Options Analyzer
- VectorVest ProGraphics v6.0
- VectorVest ProTrader 7
- VectorVest RealTime Derby Tool
- VectorVest Simulator
- VectorVest Variator
- VectorVest Watchdog
