

HOT TOPICS LIST
- MACD
- Fibonacci
- RSI
- Gann
- ADXR
- Stochastics
- Volume
- Triangles
- Futures
- Cycles
- Volatility
- ZIGZAG
- MESA
- Retracement
- Aroon
INDICATORS LIST
LIST OF TOPICS
PRINT THIS ARTICLE
by Koos van der Merwe
The bear is dead but the corpse has yet to be buried, and the daisies on the grave have still to grow. When they do, which is the daisy you should pick?
Position: Accumulate
Koos van der Merwe
Has been a technical analyst since 1969, and has worked as a futures and options trader with First Financial Futures in Johannesburg, South Africa.
PRINT THIS ARTICLE
OSCILLATORS
Which Daisy Do You Pick?
12/05/08 08:56:55 AMby Koos van der Merwe
The bear is dead but the corpse has yet to be buried, and the daisies on the grave have still to grow. When they do, which is the daisy you should pick?
Position: Accumulate
| The bear market, according to my charts, is over. The C-wave is complete, and wave 1 of the new bull market is being formed. This can, however, take some time to develop, but it does provide the opportunity to buy stocks you would have loved to own a couple of years ago — buy today at depressed prices and hold for the long term. But what stocks will be quicker off the mark? What stocks should you own for the short term? The consensus is to look for stocks that offer an above-average dividend and will not default in the months ahead. Of course, this is a gamble with ordinary shares, and many investors are looking to and buying preferred shares that offer a good yield — remember, the higher the yield, the greater the risk. With household incomes falling, however, and the holidays around the corner, where would we expect the money to go? The name Walmart is on everyone's lips, and Figure 1 is of Walmart. But there are others, like TJX Cos., as seen in Figure 2. |
|
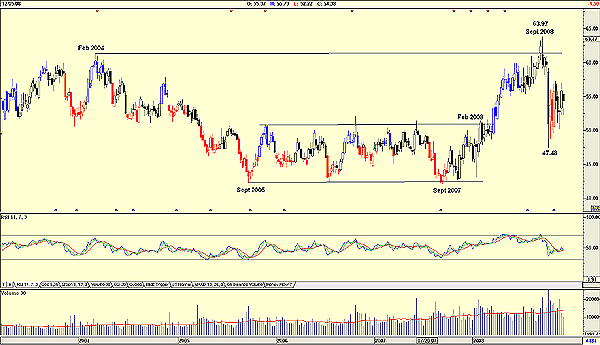
| FIGURE 1: WMT, WEEKLY. The stock price rose until February 2004, but then started to fall as the "good" years rolled in. |
| Graphic provided by: AdvancedGET. |
| |
| Figure 1, a weekly chart of Walmart, shows how the stock price rose till February 2004 but then started to fall as the "good" years rolled in, and the public spent money freely, but not at Walmart. This continued until September 2007, a few months after the stock market peaked, and the money in the public's pockets started shrinking as the recession set in. The stock price of Walmart started rising, reaching a high of $63.97 in September 2008 as the economy slowed. Then there was the drop in price to $47.48 and on high volume, a bearish sign. This stock price then rose, but on falling volume, another bearish sign, as confirmed by the relative strength index (RSI), which is falling. With the bear market now over, is the consumer moving away from Walmart, or is the consumer's purse half-empty? Is the inverse of the price movement of Walmart a forerunner of the recovery of the US economy? The latter is a question for another article. Why have I ranked TJX Cos. (TJX) alongside Walmart? After all, Walmart includes food and groceries and should therefore be compared with Costco, Safeway or any other grocery chain. I am comparing TJX stores is because they do not sell food. TJX is the leading off-price retailer of apparel and home fashions in the US and worldwide and is ranked 132 in the most recent Fortune 500 rankings. They own more than 2,500 stores and have almost 130,000 associates, and they offer the buying public a rapidly changing assortment of quality, brand-name merchandise at prices that are 20% to 60% less than department and specialty store regular prices. Stores under the TJX mantle include TJ Maxx, Marshalls, HomeGoods, and A.J. Wright in the US; Winners and HomeSense in Canada; and TK Maxx and HomeSense in Europe. |
|
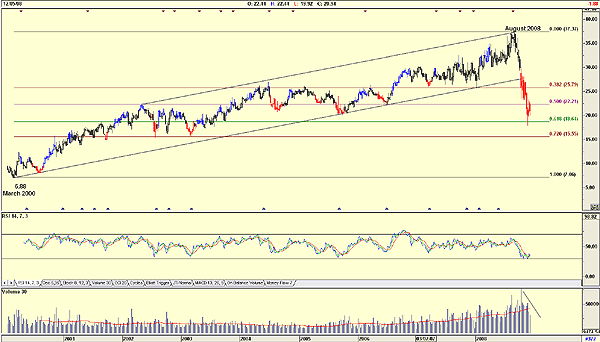
| FIGURE 2: TJX, WEEKLY. Note how the stock price rose from March 2000 to August 2008. |
| Graphic provided by: AdvancedGET. |
| |
| Figure 2 shows how the stock price rose from March 2000 until August 2008, and over a period when the major market indexes went through a bear–bull market move. Why the fall from August 2008? Possibly a sign that clothes and gifts were no longer at the top of the shopping list, but note how the stock price fell on falling volume, a sign of strength, confirmed by the RSI, which is at or approaching oversold levels. Fibonacci retracement does show that the stock price tested the 61.8% level at $18.64. With the holidays approaching and with a cash-strapped public looking for gifts in their present price range, we may see sales in TJX stores improve significantly. Sales for the four-week period ending November 29, 2008, was a 9% decrease from the previous year, and this is a stock that we could purchase simply because as the market moves out of recession over the coming years, the price will recover and continue its inexorable rise. |
Has been a technical analyst since 1969, and has worked as a futures and options trader with First Financial Futures in Johannesburg, South Africa.
| Address: | 3256 West 24th Ave |
| Vancouver, BC | |
| Phone # for sales: | 6042634214 |
| E-mail address: | petroosp@gmail.com |
Click here for more information about our publications!
PRINT THIS ARTICLE

Request Information From Our Sponsors
- StockCharts.com, Inc.
- Candle Patterns
- Candlestick Charting Explained
- Intermarket Technical Analysis
- John Murphy on Chart Analysis
- John Murphy's Chart Pattern Recognition
- John Murphy's Market Message
- MurphyExplainsMarketAnalysis-Intermarket Analysis
- MurphyExplainsMarketAnalysis-Visual Analysis
- StockCharts.com
- Technical Analysis of the Financial Markets
- The Visual Investor
- VectorVest, Inc.
- Executive Premier Workshop
- One-Day Options Course
- OptionsPro
- Retirement Income Workshop
- Sure-Fire Trading Systems (VectorVest, Inc.)
- Trading as a Business Workshop
- VectorVest 7 EOD
- VectorVest 7 RealTime/IntraDay
- VectorVest AutoTester
- VectorVest Educational Services
- VectorVest OnLine
- VectorVest Options Analyzer
- VectorVest ProGraphics v6.0
- VectorVest ProTrader 7
- VectorVest RealTime Derby Tool
- VectorVest Simulator
- VectorVest Variator
- VectorVest Watchdog