

HOT TOPICS LIST
- MACD
- Fibonacci
- RSI
- Gann
- ADXR
- Stochastics
- Volume
- Triangles
- Futures
- Cycles
- Volatility
- ZIGZAG
- MESA
- Retracement
- Aroon
INDICATORS LIST
LIST OF TOPICS
PRINT THIS ARTICLE
by Arthur Hill
A high-volume resistance break and relative strength point to further upside for Bristol-Myers Squibb.
Position: Buy
Arthur Hill
Arthur Hill is currently editor of TDTrader.com, a website specializing in trading strategies, sector/industry specific breadth stats and overall technical analysis. He passed the Society of Technical Analysts (STA London) diploma exam with distinction is a Certified Financial Technician (CFTe). Prior to TD Trader, he was the Chief Technical Analyst for Stockcharts.com and the main contributor to the ChartSchool.
PRINT THIS ARTICLE
REL. STR COMPARATIVE
Breakout For Bristol-Myers
12/05/08 08:38:24 AMby Arthur Hill
A high-volume resistance break and relative strength point to further upside for Bristol-Myers Squibb.
Position: Buy
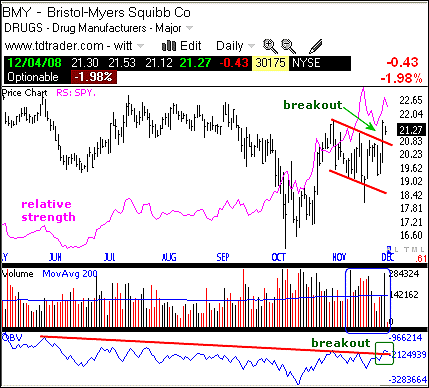
| Figure 1 shows Bristol-Myers Squibb (BMY) with daily bars over the last seven months. The stock surged in October, formed a falling flag in November, and surged again in early December. This second surge triggered a flag breakout that signals a continuation of the October surge. |
|
| FIGURE 1: BMY, DAILY. The stock surged in October, formed a falling flag in November, and surged again in early December. |
| Graphic provided by: TeleChart2007. |
| |
| Relative strength and volume confirm the breakout. The magenta line shows the relative strength comparative, which compares the performance of BMY to the Standard & Poor's 500 exchange traded fund (ETF) (SPY). BMY started outperforming in mid-September as the relative strength comparative moved sharply higher. The bottom indicator window shows on-balance volume (OBV) breaking above its May trendline over the last few days. Upside volume is outpacing downside volume, and this validates the breakout. |
|
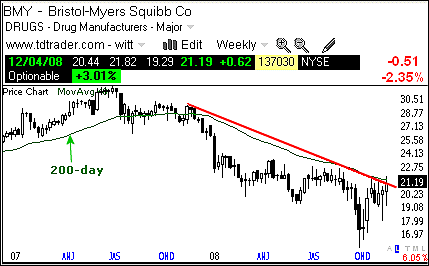
| FIGURE 2: BMY, WEEKLY. Here, BMY is trading near its 40-week moving average (200-day) and the trendline is extending down from November 2007. |
| Graphic provided by: TeleChart2007. |
| |
| Figure 2 shows weekly candlesticks over the last two years. BMY is trading near its 40-week moving average (200-day) and the trendline extending down from November 2007. The long-term downtrend is at its moment of truth. Based on the flag breakout above, I would expect a breakout on the weekly chart as well. A move above the trendline and 40-week moving average would show the most strength in over a year and reverse the long-term downtrend. |
Arthur Hill is currently editor of TDTrader.com, a website specializing in trading strategies, sector/industry specific breadth stats and overall technical analysis. He passed the Society of Technical Analysts (STA London) diploma exam with distinction is a Certified Financial Technician (CFTe). Prior to TD Trader, he was the Chief Technical Analyst for Stockcharts.com and the main contributor to the ChartSchool.
| Title: | Editor |
| Company: | TDTrader.com |
| Address: | Willem Geetsstraat 17 |
| Mechelen, B2800 | |
| Phone # for sales: | 3215345465 |
| Website: | www.tdtrader.com |
| E-mail address: | arthurh@tdtrader.com |
Traders' Resource Links | |
| TDTrader.com has not added any product or service information to TRADERS' RESOURCE. | |
Click here for more information about our publications!
Comments
Date:�12/09/08Rank:�4Comment:�

Request Information From Our Sponsors
- StockCharts.com, Inc.
- Candle Patterns
- Candlestick Charting Explained
- Intermarket Technical Analysis
- John Murphy on Chart Analysis
- John Murphy's Chart Pattern Recognition
- John Murphy's Market Message
- MurphyExplainsMarketAnalysis-Intermarket Analysis
- MurphyExplainsMarketAnalysis-Visual Analysis
- StockCharts.com
- Technical Analysis of the Financial Markets
- The Visual Investor
- VectorVest, Inc.
- Executive Premier Workshop
- One-Day Options Course
- OptionsPro
- Retirement Income Workshop
- Sure-Fire Trading Systems (VectorVest, Inc.)
- Trading as a Business Workshop
- VectorVest 7 EOD
- VectorVest 7 RealTime/IntraDay
- VectorVest AutoTester
- VectorVest Educational Services
- VectorVest OnLine
- VectorVest Options Analyzer
- VectorVest ProGraphics v6.0
- VectorVest ProTrader 7
- VectorVest RealTime Derby Tool
- VectorVest Simulator
- VectorVest Variator
- VectorVest Watchdog