HOT TOPICS LIST
- MACD
- Fibonacci
- RSI
- Gann
- ADXR
- Stochastics
- Volume
- Triangles
- Futures
- Cycles
- Volatility
- ZIGZAG
- MESA
- Retracement
- Aroon
INDICATORS LIST
LIST OF TOPICS
PRINT THIS ARTICLE
by Donald W. Pendergast, Jr.
Harmony Gold Mining, one of the better-performing gold stocks in the Philadelphia Gold and Silver Index, may have fairly low-risk trade setups going for both long- and short-term traders.
Position: Accumulate
Donald W. Pendergast, Jr.
Donald W. Pendergast is a financial markets consultant who offers specialized services to stock brokers and high net worth individuals who seek a better bottom line for their portfolios.
PRINT THIS ARTICLE
CYCLES
A Harmonious Relationship: HMY and XAU
12/04/08 08:55:25 AMby Donald W. Pendergast, Jr.
Harmony Gold Mining, one of the better-performing gold stocks in the Philadelphia Gold and Silver Index, may have fairly low-risk trade setups going for both long- and short-term traders.
Position: Accumulate
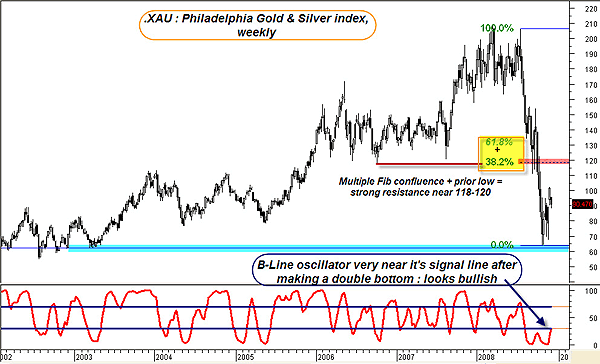
| The Philadelphia Gold and Silver Index (XAU) is still 57% off of its March 2008 high. Like most other indexes, this one got creamed in the global meltdown mania that accelerated in July 2008. The weekly chart details all of the technical damage, but at this point, the worst phase of the plunge appears to be behind (Figure 1). Right now, the most intriguing development is the double-bottom pattern in the B-line oscillator, a reliable cycle identification tool that frequently demonstrates remarkable staying power once it crosses a signal line in either direction. It's especially useful in determining the cycle in the next higher time frame than the one used to actually trade in; using the B-line this way can help keep you on the right side of a trending move. Of course, since the XAU is in a de facto downtrend, there will be plenty of overhead resistance to overcome, even if price breaks higher. The $118–120 zone is the strongest Fibonacci confluence resistance (38.2% / 68.1%), made even stronger due to the August 2007 low (horizontal red line). So while the XAU has some room to run, expect a major battle near $120 should it rise that far. Let's look at a weekly chart of Harmony Gold Mining (HMY) and see how HMY compares to the current B-line momentum of the XAU, HMY's parent index. See Figure 2. |

|
| FIGURE 1: XAU, WEEKLY. A rising weekly price cycle; strong upward momentum may soon face heavy overhead resistance. |
| Graphic provided by: MetaStock. |
| Graphic provided by: WB B-Line EOD from ProfitTrader for Metastock. |
| |
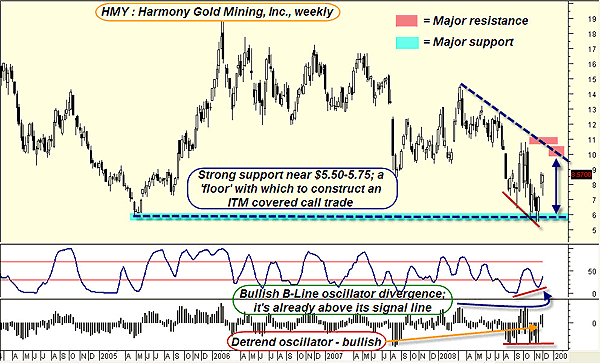
| HMY has fared slightly better than the XAU, down about 41% from its March 2008 high. This South Africa–based miner has about 50 million ounces of proven/probable gold reserves and conducts mining operations in South Africa, Australia, and Papua New Guinea. Technically, the weekly chart of HMY is actually a little more bullish than the XAU. The B-line oscillator, after printing a bullish divergence pattern, has already crossed above its signal line, confirming the rising weekly cycle. HMY is currently at about $8.57, so it has another $2.00 in upside potential before strong overhead resistance near $10.50 begins to interfere. At the same time, the stock seems to be respecting the general support area of $5.50–5.75, forming a $4–5 trading range with a descending upper channel. The major support near $5.50 looks like a great way to set up a deep-in-the-money, long-term covered-call trade, while the nice trading range and current daily swing characteristics of HMY's daily chart (Figure 3) suggest that a solid daily long breakout trade is within a few cents of a buy-stop entry. |

|
| FIGURE 2: HMY, WEEKLY. See the support, resistance, and a rising price cycle in between. |
| Graphic provided by: MetaStock. |
| Graphic provided by: Various indicators from ProfitTrader for Metastock. |
| |
| Checking HMY's option volatility reading, it's still right near the top of its two-year range, so it's a good time to sell options. For a longer-term trader, one that's bullish on gold, a January 2010 $5 call can be sold for approximately 4.80. As long as HMY closes above $5.00 at expiration, the stock will be called away, leaving the trader with a profit of about $123 for each covered call position. That's not too bad for a 13-month investment with a net cash outlay of only $377. If the stock is below $5.00, the trader keeps the stock and all of the $480 in option premiums and can choose to sell another call against his 100 shares of HMY, if desired. |

|
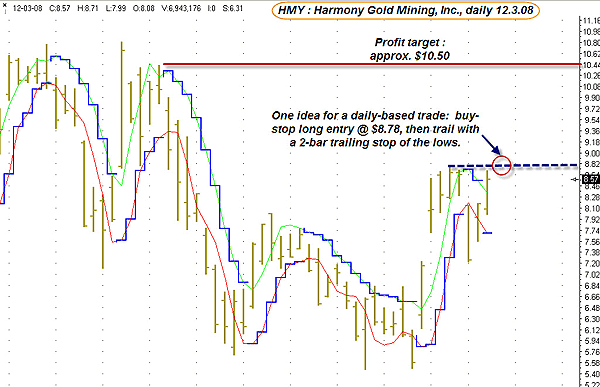
| FIGURE 3: HMY, DAILY. Here's a breakout buy setup with a decent risk-reward ratio, especially considering the higher time frame's momentum. |
| Graphic provided by: Ensign Windows. |
| |
| For short-term traders, here's an idea: using a daily chart of HMY, enter long on a buy-stop order at $8.78 and then trail the position with a two-bar trailing stop of the lows. The initial profit target is approximately (1 * (the previous swing of 5.49 - 8.77) + 7.22)) = $10.50. That's a rough guesstimate, but at least it can give a short-term swing trader something to work with. One reason this is a potentially attractive daily-based swing trade is the combined upward momentum of both the XAU and HMY weekly B-line oscillators, both of which appear to be very bullish. When the trend and/or price cycle from the next higher time frame is biased in the direction of your lower time frame entry, the odds of success are typically enhanced. |
| A very simple set of technical patterns and indicators yielded at least two trade setups in HMY, one for patient long-term investors and the other for aggressive short-term swing traders. Can you locate any other potential setups? |
Donald W. Pendergast is a financial markets consultant who offers specialized services to stock brokers and high net worth individuals who seek a better bottom line for their portfolios.
| Title: | Writer, market consultant |
| Company: | Linear Trading Systems LLC |
| Jacksonville, FL 32217 | |
| Phone # for sales: | 904-239-9564 |
| E-mail address: | lineartradingsys@gmail.com |
Traders' Resource Links | |
| Linear Trading Systems LLC has not added any product or service information to TRADERS' RESOURCE. | |
Click here for more information about our publications!
Comments
Date: 12/09/08Rank: 3Comment:

Request Information From Our Sponsors
- StockCharts.com, Inc.
- Candle Patterns
- Candlestick Charting Explained
- Intermarket Technical Analysis
- John Murphy on Chart Analysis
- John Murphy's Chart Pattern Recognition
- John Murphy's Market Message
- MurphyExplainsMarketAnalysis-Intermarket Analysis
- MurphyExplainsMarketAnalysis-Visual Analysis
- StockCharts.com
- Technical Analysis of the Financial Markets
- The Visual Investor
- VectorVest, Inc.
- Executive Premier Workshop
- One-Day Options Course
- OptionsPro
- Retirement Income Workshop
- Sure-Fire Trading Systems (VectorVest, Inc.)
- Trading as a Business Workshop
- VectorVest 7 EOD
- VectorVest 7 RealTime/IntraDay
- VectorVest AutoTester
- VectorVest Educational Services
- VectorVest OnLine
- VectorVest Options Analyzer
- VectorVest ProGraphics v6.0
- VectorVest ProTrader 7
- VectorVest RealTime Derby Tool
- VectorVest Simulator
- VectorVest Variator
- VectorVest Watchdog
