HOT TOPICS LIST
- MACD
- Fibonacci
- RSI
- Gann
- ADXR
- Stochastics
- Volume
- Triangles
- Futures
- Cycles
- Volatility
- ZIGZAG
- MESA
- Retracement
- Aroon
INDICATORS LIST
LIST OF TOPICS
PRINT THIS ARTICLE
by Chaitali Mohile
The rally in Intel Corp. failed under the key resistance levels on the intraday charts, but the long-term movement could decide future price action.
Position: N/A
Chaitali Mohile
Active trader in the Indian stock markets since 2003 and a full-time writer. Trading is largely based upon technical analysis.
PRINT THIS ARTICLE
TRADING SYSTEMS
Intel Under Pressure
12/04/08 11:00:57 AMby Chaitali Mohile
The rally in Intel Corp. failed under the key resistance levels on the intraday charts, but the long-term movement could decide future price action.
Position: N/A
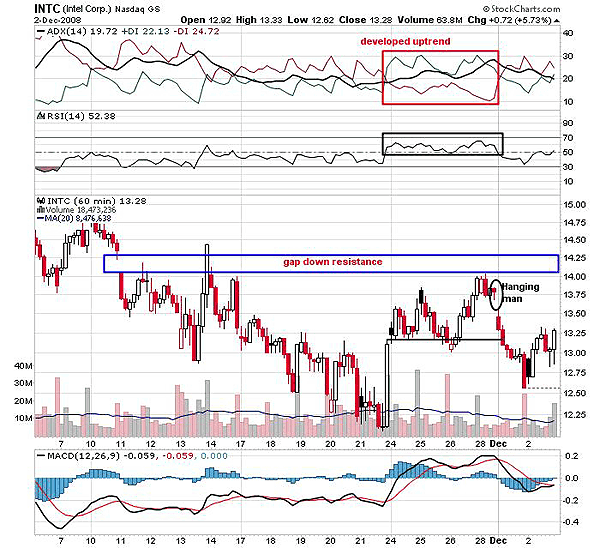
| The trading sessions towards the end of November 2008 showed strong bullish notes. Intel (INTC) made an intraday gain of a dollar by rallying from 12.20 to 13.25 levels on November 23. Thereafter, the stock sustained above the new support at 13.25 throughout the week. In Figure 1, we can see that INTC consolidated at the gapdown resistance at 14. After undergoing the rally for a week, INTC declined under the resistance on an intraday high. The stock gapped down in mid-November and formed lower lows. The gapdown resistance was challenged on November 14, but due to a developing downtrend, the stock failed to violate the resistance. INTC moved to the same resistance in the past week under a well-developed uptrend. But the hanging man candlestick pattern formed during the last trading hours was a strong bearish reversal signal. |

|
| FIGURE 1: INTC, HOURLY. The hanging man bearish reversal pattern followed by the gapdown opening reversed the developing uptrend on this chart. |
| Graphic provided by: StockCharts.com. |
| |
| On the hourly chart (Figure 1), the gap down opening of INTC in early December was a twist for the developing uptrend earlier in the week. The average directional movement index (ADX) (14) showed a developing uptrend, and the possibility of an uptrend moving stronger. But the gap down reversed the bullish trend. The hanging man candlestick formation was the major bearish reversal indication in the developing uptrend in Figure 1. The relative strength index (RSI) (14) also plunged to bearish levels after a bullish week. The support level of 13.25 is freshly turned to resistance, and we can see that the trading session of November 3 closed under the same resistance. So 13.25 is the immediate resistance that can suppress the rally. But most important, I would keep an eye on the gap down resistance level for the next few days, as a fresh bullish move can be anticipated above resistance at 14. |
| According to Figure 1, the ADX (14) shows equal pressure from bulls and the bears, but if the indicator sees increased buying pressure, we can see the rally toward the resistance at 14. The RSI (14) is ready to move above the golden level at 50, indicating a good buying opportunity for high-risk traders. In addition, the moving average convergence/divergence (MACD) (12,26,9) may surge to positive territory above the zero line after undergoing a bullish crossover. In current market conditions, we can keep a very short-term view for a week as the situations across the globe are highly sensitive. The confirmed bullish signs by the indicators and price movement may give birth to the small rallies. Traders can initiate a long trade under these bullish notes. |

|
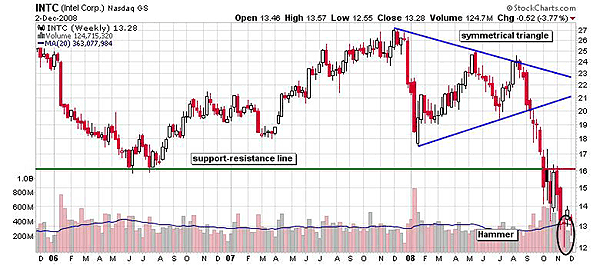
| FIGURE 2: INTC, WEEKLY. Intel has hit the minimum estimated level of the symmetrical triangle breakout. The hammer candlestick pattern formed at the bottom indicates the possibility of trend reversal. |
| Graphic provided by: StockCharts.com. |
| |
| In Figure 2, the long-term symmetrical triangle broke in September 2008. Thereafter, INTC took a nosedive to new lows. The length of triangle is 27 - 18 = 9; therefore, a breakout level minus the length gives the estimated target, 20 - 9 = 11. The low formed is near the target of a symmetrical triangle breakout. The marked circle in Figure 2 shows the hammer candlestick pattern with the low at the 12 level. The hammer candlestick is a bullish reversal pattern, indicating a hammered downtrend, and suggests that a fresh upside rally could be under way. The support-resistance line shows the key resistance at 16, so the stock is likely to remain rangebound for a longer period. Traders can enter the long trade at 12 with a target of 14 (intraday range), and the next target at 16 with longer-term perspective. Further, short trading is possible at the 16 level with the target of 12. |
| Thus, the tug-of-war between the bulls and bears would keep INTC rangebound for a while. |
Active trader in the Indian stock markets since 2003 and a full-time writer. Trading is largely based upon technical analysis.
| Company: | Independent |
| Address: | C1/3 Parth Indraprasth Towers. Vastrapur |
| Ahmedabad, Guj 380015 | |
| E-mail address: | chaitalimohile@yahoo.co.in |
Traders' Resource Links | |
| Independent has not added any product or service information to TRADERS' RESOURCE. | |
Click here for more information about our publications!
PRINT THIS ARTICLE

Request Information From Our Sponsors
- StockCharts.com, Inc.
- Candle Patterns
- Candlestick Charting Explained
- Intermarket Technical Analysis
- John Murphy on Chart Analysis
- John Murphy's Chart Pattern Recognition
- John Murphy's Market Message
- MurphyExplainsMarketAnalysis-Intermarket Analysis
- MurphyExplainsMarketAnalysis-Visual Analysis
- StockCharts.com
- Technical Analysis of the Financial Markets
- The Visual Investor
- VectorVest, Inc.
- Executive Premier Workshop
- One-Day Options Course
- OptionsPro
- Retirement Income Workshop
- Sure-Fire Trading Systems (VectorVest, Inc.)
- Trading as a Business Workshop
- VectorVest 7 EOD
- VectorVest 7 RealTime/IntraDay
- VectorVest AutoTester
- VectorVest Educational Services
- VectorVest OnLine
- VectorVest Options Analyzer
- VectorVest ProGraphics v6.0
- VectorVest ProTrader 7
- VectorVest RealTime Derby Tool
- VectorVest Simulator
- VectorVest Variator
- VectorVest Watchdog
