HOT TOPICS LIST
- MACD
- Fibonacci
- RSI
- Gann
- ADXR
- Stochastics
- Volume
- Triangles
- Futures
- Cycles
- Volatility
- ZIGZAG
- MESA
- Retracement
- Aroon
INDICATORS LIST
LIST OF TOPICS
PRINT THIS ARTICLE
by Donald W. Pendergast, Jr.
With crude oil off by $100 since its all-time high and natural gas cut in half, some technicians believe a technical relief rally is all but inevitable for the energy sector.
Position: Buy
Donald W. Pendergast, Jr.
Donald W. Pendergast is a financial markets consultant who offers specialized services to stock brokers and high net worth individuals who seek a better bottom line for their portfolios.
PRINT THIS ARTICLE
CYCLES
With IEO, Calculated Bet On A Technical Rally
12/03/08 09:14:23 AMby Donald W. Pendergast, Jr.
With crude oil off by $100 since its all-time high and natural gas cut in half, some technicians believe a technical relief rally is all but inevitable for the energy sector.
Position: Buy
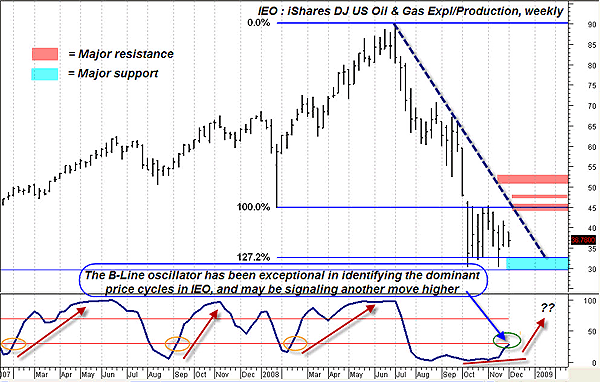
| Despite crude oil's brief dip below $47, natural gas seems to have finally leveled off and the stocks in the Dow Jones US Select Oil Exploration and Production index didn't appear to be upset, refusing to match crude's descent to new bear market lows. A glance at the weekly chart of IEO, the iShares ETF that tracks that DJ index (Figure 1), shows that some potentially bullish technicals are falling into place for a possible relief rally. Price has so far respected the $30 level, forming a support level there, just above a 127.2% Fibonacci expansion barrier. More important is the move higher by the B-line oscillator, a tool that is very accurate at identifying the dominant price cycle in any given tradable. It successfully identified three prior bullish moves when it crossed above its signal line, so perhaps this one will prove out as well. Since IEO is in a bear market, any rally may be of shorter duration, since it would be countertrend. Even with that, IEO doesn't face serious channel and/or Fibonacci resistance until $43 to $45.50, after which the open gap at $46.60 to $47.80 and then the Fib barriers at $50 to $52.75 come into play. |

|
| FIGURE 1: IEO, WEEKLY. Support, price cycles, and resistance frame out an interesting technical picture. |
| Graphic provided by: MetaStock. |
| Graphic provided by: WB B-Line from ProfitTrader for MetaStock. |
| |
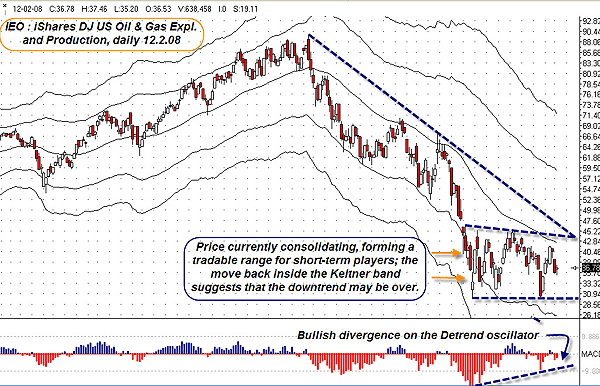
| Let's look at the daily chart of IEO (Figure 2) for some added insight and then examine how both long-term and short-term traders might find opportunity in IEO. The most prominent technical features are the clearly defined trading range and the bullish price-momentum divergence on the detrend oscillator. Short-term traders may wish to initiate positions as price hits either side of the range, limiting risk by timing entries on a 60-minute chart and using a trailing stop. Longer-term traders who subscribe to the technical relief rally angle might consider selling a March 2009 $37 call option against 100 shares of IEO, currently selling for about $6.00. If the stock is called away at March expiration, such a trader would walk away about $620 richer. If at expiration the stock closes above $30.78, the trade is profitable, and if it closes at anything less than $37, the trader keeps his shares of IEO and can sell another call against it. In case the stock tumbles quickly after putting on the trade, breaking support at $30.18 on strong volume, the trader can always close out the trade for a loss, being sure to risk no more than 1–2% of his account equity if such a breakdown would occur. Planning out the worst-case scenario before you actually place a trade will make trade management much easier on your nerves and your wallet. |

|
| FIGURE 2: IEO, DAILY. This chart reveals a well-defined trading range and bullish price-momentum divergence. |
| Graphic provided by: Ensign Windows. |
| |
| Are there other clues that the big money is starting to get interested in the oil and gas industry group again? Yes. Recent Commitment of Traders data trends suggest that the commercial interests are very bullish on natural gas and fairly bullish on crude oil. In a similar vein, ExxonMobil (XOM) has been outperforming the Standard & Poor's 500 by a wide margin over the past 13 weeks, another bullish sign that the smart money is beginning to accumulate beaten-down oil and gas shares at bargain prices. With crude oil, an essential industrial commodity, down by $100 in less than five months, a technical rally is likely to occur sooner rather than later, taking shares of IEO along for the ride. Both short-term and long-term traders should have no problem choosing a profitable strategy, should that rally happen. |
Donald W. Pendergast is a financial markets consultant who offers specialized services to stock brokers and high net worth individuals who seek a better bottom line for their portfolios.
| Title: | Writer, market consultant |
| Company: | Linear Trading Systems LLC |
| Jacksonville, FL 32217 | |
| Phone # for sales: | 904-239-9564 |
| E-mail address: | lineartradingsys@gmail.com |
Traders' Resource Links | |
| Linear Trading Systems LLC has not added any product or service information to TRADERS' RESOURCE. | |
Click here for more information about our publications!
Comments
Date: 12/09/08Rank: 4Comment:

Request Information From Our Sponsors
- StockCharts.com, Inc.
- Candle Patterns
- Candlestick Charting Explained
- Intermarket Technical Analysis
- John Murphy on Chart Analysis
- John Murphy's Chart Pattern Recognition
- John Murphy's Market Message
- MurphyExplainsMarketAnalysis-Intermarket Analysis
- MurphyExplainsMarketAnalysis-Visual Analysis
- StockCharts.com
- Technical Analysis of the Financial Markets
- The Visual Investor
- VectorVest, Inc.
- Executive Premier Workshop
- One-Day Options Course
- OptionsPro
- Retirement Income Workshop
- Sure-Fire Trading Systems (VectorVest, Inc.)
- Trading as a Business Workshop
- VectorVest 7 EOD
- VectorVest 7 RealTime/IntraDay
- VectorVest AutoTester
- VectorVest Educational Services
- VectorVest OnLine
- VectorVest Options Analyzer
- VectorVest ProGraphics v6.0
- VectorVest ProTrader 7
- VectorVest RealTime Derby Tool
- VectorVest Simulator
- VectorVest Variator
- VectorVest Watchdog
