HOT TOPICS LIST
- MACD
- Fibonacci
- RSI
- Gann
- ADXR
- Stochastics
- Volume
- Triangles
- Futures
- Cycles
- Volatility
- ZIGZAG
- MESA
- Retracement
- Aroon
INDICATORS LIST
LIST OF TOPICS
PRINT THIS ARTICLE
by Koos van der Merwe
The stock of this Canadian-based company, which develops small, all-electric vehicles, may bear some examination.
Position: Buy
Koos van der Merwe
Has been a technical analyst since 1969, and has worked as a futures and options trader with First Financial Futures in Johannesburg, South Africa.
PRINT THIS ARTICLE
MA ENVELOPES
Zenn Motor Co. Worth A Look
12/03/08 01:08:42 PMby Koos van der Merwe
The stock of this Canadian-based company, which develops small, all-electric vehicles, may bear some examination.
Position: Buy
| Recently, the world was entertained by Congress balking at a rescue package for the US auto industry. Chrysler, General Motors, and Ford Motor Co. warned Congress and the world that they could face bankruptcy without a bailout package. Investors are worrying about financial companies' exposure to the Big Three automakers, as well as to automotive suppliers and dealers, but many in the public eye insist that they should face Chapter 11 as punishment for their inefficiency and arrogance. "You have all flown here in private jets, with a tin cup in your hands," one Congressman admonished them. They must now present a restructuring plan, which includes union submission to Congress before they receive a cent. If the three automakers do go broke, which I doubt, what are the alternatives other than Asian cars? One of them is the Zenn Motor Co. |

|
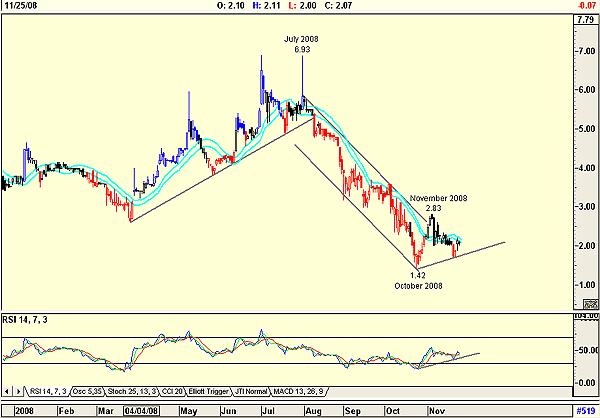
| FIGURE 1: ZENN MOTOR, DAILY. The RSI shown suggests that the trend is up. |
| Graphic provided by: AdvancedGET. |
| |
| The Zenn Motor Co. is a Canadian-based company that develops small, purely electric vehicles. Its initial focus was to develop cars suitable for the neighborhood electric vehicle (NEV) market. This was to be a steppingstone toward developing freeway-capable vehicles, but the car is proving popular among environmentalists, but there is more to it than just benefiting the environment, because Zenn drivers are also rewarded in the wallet. As an example, let's assume you drive 200 miles per week in an SUV. If gasoline costs you $2.86 per gallon and electricity costs you six cents per kilowatt per hour, then your annual fuel savings would total $2,175.68 by driving a Zenn. Plus, Zenn lets you drive worry-free with a minimum of maintenance hassle and expense. Saving the environment and money -- it's a good deal all around! What does the chart tell us? |

|
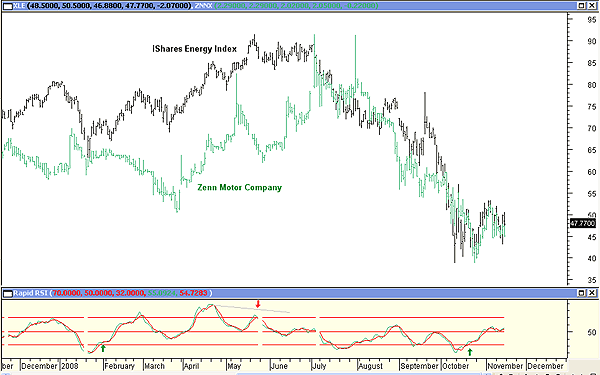
| FIGURE 2: ZENN VS. ISHARE ENERGY INDEX. Here's a comparison of the movement in the share price of Zenn Motor with that of the iShare Energy Index. |
| Graphic provided by: MetaStock. |
| |
| Figure 1 is a daily chart of the Zenn Motor Co. as listed on the Vancouver Stock Exchange. The chart shows how the price fell from $6.93 in July 2008 to $1.42 by October 2008. It then rose $2.83 in November and has since fallen back to $2.07. The relative strength index (RSI) shown is suggesting that the trend is up, and we could either buy at these levels, or wait for a break above the internal JM band shown. An internal JM band is a 15-period simple moving average offset by 2% and -2%. A move above the upper band signals a buy, and a move below the lower band signals a sell. |
| Investor sentiment appears to be following the price of oil. Figure 2 shows how the share price of Zenn Motor closely followed the movement of the iShare Energy Index. My indicator here is the rapid RSI, and this indicator is showing a buy signal for the iShare Energy Index, suggesting a buy signal for Zenn Motor. We could consider buying the stock at present prices, or if you are a conservative investor, wait for a move above the upper JM band. |
Has been a technical analyst since 1969, and has worked as a futures and options trader with First Financial Futures in Johannesburg, South Africa.
| Address: | 3256 West 24th Ave |
| Vancouver, BC | |
| Phone # for sales: | 6042634214 |
| E-mail address: | petroosp@gmail.com |
Click here for more information about our publications!
PRINT THIS ARTICLE

Request Information From Our Sponsors
- VectorVest, Inc.
- Executive Premier Workshop
- One-Day Options Course
- OptionsPro
- Retirement Income Workshop
- Sure-Fire Trading Systems (VectorVest, Inc.)
- Trading as a Business Workshop
- VectorVest 7 EOD
- VectorVest 7 RealTime/IntraDay
- VectorVest AutoTester
- VectorVest Educational Services
- VectorVest OnLine
- VectorVest Options Analyzer
- VectorVest ProGraphics v6.0
- VectorVest ProTrader 7
- VectorVest RealTime Derby Tool
- VectorVest Simulator
- VectorVest Variator
- VectorVest Watchdog
- StockCharts.com, Inc.
- Candle Patterns
- Candlestick Charting Explained
- Intermarket Technical Analysis
- John Murphy on Chart Analysis
- John Murphy's Chart Pattern Recognition
- John Murphy's Market Message
- MurphyExplainsMarketAnalysis-Intermarket Analysis
- MurphyExplainsMarketAnalysis-Visual Analysis
- StockCharts.com
- Technical Analysis of the Financial Markets
- The Visual Investor
