HOT TOPICS LIST
- MACD
- Fibonacci
- RSI
- Gann
- ADXR
- Stochastics
- Volume
- Triangles
- Futures
- Cycles
- Volatility
- ZIGZAG
- MESA
- Retracement
- Aroon
INDICATORS LIST
LIST OF TOPICS
PRINT THIS ARTICLE
by Donald W. Pendergast, Jr.
Though each of these inflation-sensitive commodities has fallen from their respective highs, gold is outperforming crude oil by a wide margin.
Position: Accumulate
Donald W. Pendergast, Jr.
Donald W. Pendergast is a financial markets consultant who offers specialized services to stock brokers and high net worth individuals who seek a better bottom line for their portfolios.
PRINT THIS ARTICLE
REL. STR COMPARATIVE
Gold Outperforming Crude By Wide Margin
12/01/08 09:26:34 AMby Donald W. Pendergast, Jr.
Though each of these inflation-sensitive commodities has fallen from their respective highs, gold is outperforming crude oil by a wide margin.
Position: Accumulate
| In the first half of 2008, it appeared that the global commodity bull was all but unstoppable. Gold had finally closed above the magical $1,000 mark and crude oil was setting so many new daily price records that by early July it almost seemed routine. Gold pulled back hard in the spring, falling to the mid-$800s before taking another shot at $1,000, which failed in July. Goldbugs watched as their beloved metal eventually dipped below $700, only two weeks ago. Meanwhile, crude oil chugged steadily higher from February to July with hardly more than a few minor corrections along the way — until the bottom fell out of the oil market in mid-July. Crude then proceeded to plunge by 67% in only four and a half months, one of the steeper selloffs of the entire 2000–08 commodity bull run. Let's look at a series of charts and see what we can discern about the current technical state of these two unique commodities. |

|
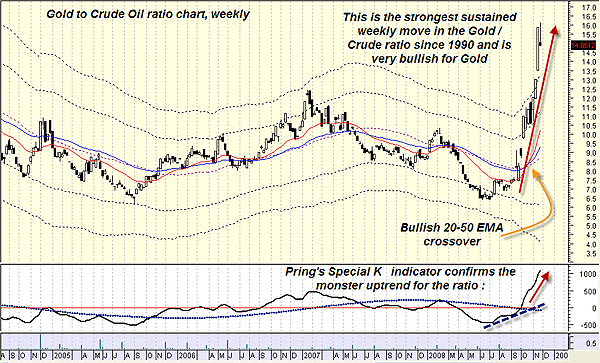
| FIGURE 1: GOLD TO CRUDE, WEEKLY. A parabolic rise: will it lead to further gains in the ratio, or is a pullback due? |
| Graphic provided by: MetaStock. |
| |
| First, the gold to crude oil weekly ratio chart: The ratio varied between 27.85 (December 1993) and 6.18 (September 2005) and is now rising sharply, having briefly touched the 16 level this week. The current uptrend is likely the strongest since 1990, featuring a total penetration of the outer Keltner bands, a bullish 20–50 exponential moving average (EMA) crossover and an especially bullish reading on the Pring Special K indicator, a unique momentum/rate of change tool that helps keep traders on the right side of a primary trend. All of this technical information is confirming the fact that gold is outperforming crude oil, and by a large degree. A look at the individual weekly charts of gold and crude oil will help paint a clearer picture of the radically different trend characteristics of these two components of the gold/crude oil ratio chart. |

|
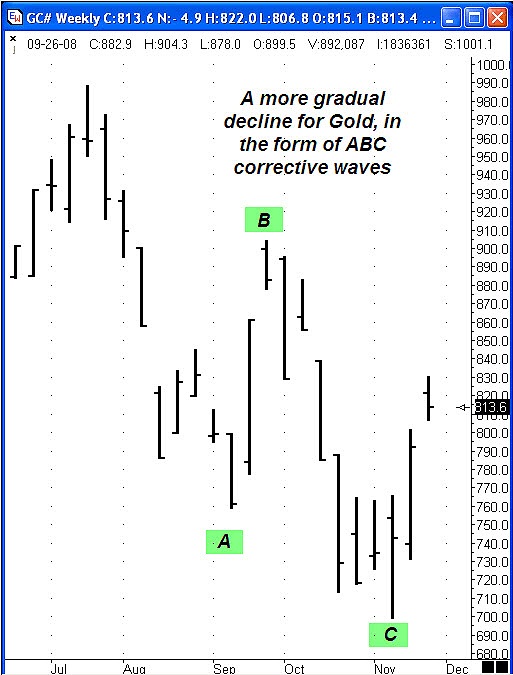
| FIGURE 2: GOLD. Gold traces out a well-proportioned A-B-C corrective pattern. |
| Graphic provided by: Ensign Windows. |
| |
| The weekly gold chart (continuous contract) shows a substantial decline as it traced out a large ABC corrective pattern (Figure 1). Gold lost about 32% of its value from the July 2008 peak to the November 2008 low. Recent Commitment of Traders data suggests that the large commercial interests were actively covering open short positions as this corrective pattern played out. If the large speculators (hedge funds and other well-capitalized trend-followers) begin to jump back into gold as fears of global inflation spread, gold may very well make a third attempt at the $1,000 price level. Interestingly, the commercial interests also appear to have been accumulating (for many weeks) crude oil contracts at a fast clip, so perhaps the last few days of positive price action is a precursor to a much larger bullish breakout in crude oil. See Figure 2. |

|
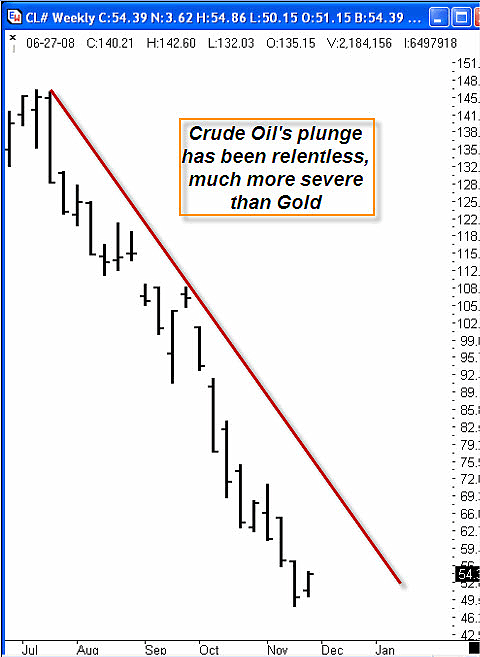
| FIGURE 3: CRUDE OIL. After a 67% plunge, crude oil may be in the early stages of a corrective rally. |
| Graphic provided by: Ensign Windows. |
| |
| Finally, the weekly crude oil (continuous contract) chart (Figure 3). In stark contrast to gold, note how crude oil fell with hardly any corrective moves at all, falling as much as 67% from July 2008 to November 2008. Now we see one of the prime reasons why the gold/crude oil ratio chart is so heavily biased in favor of gold — gold simply fell a lot less than crude oil did, and at a much lower rate of speed. Gold is also up by nearly $115 in the last two weeks even as crude oil has only risen $5 during the same period, which explains part of the recent parabolic rise on the ratio chart. |
| Many gold and oil bulls still believe that each of these commodities is destined for much higher prices in the years to come. For a variety of reasons, right now, gold has taken the lead, outperforming crude oil by a surprising margin. I rate gold as a solid accumulate on weekly pullbacks and crude oil as a hold for those already long. |
Donald W. Pendergast is a financial markets consultant who offers specialized services to stock brokers and high net worth individuals who seek a better bottom line for their portfolios.
| Title: | Writer, market consultant |
| Company: | Linear Trading Systems LLC |
| Jacksonville, FL 32217 | |
| Phone # for sales: | 904-239-9564 |
| E-mail address: | lineartradingsys@gmail.com |
Traders' Resource Links | |
| Linear Trading Systems LLC has not added any product or service information to TRADERS' RESOURCE. | |
Click here for more information about our publications!
Comments
Date: 12/03/08Rank: 5Comment:

Request Information From Our Sponsors
- StockCharts.com, Inc.
- Candle Patterns
- Candlestick Charting Explained
- Intermarket Technical Analysis
- John Murphy on Chart Analysis
- John Murphy's Chart Pattern Recognition
- John Murphy's Market Message
- MurphyExplainsMarketAnalysis-Intermarket Analysis
- MurphyExplainsMarketAnalysis-Visual Analysis
- StockCharts.com
- Technical Analysis of the Financial Markets
- The Visual Investor
- VectorVest, Inc.
- Executive Premier Workshop
- One-Day Options Course
- OptionsPro
- Retirement Income Workshop
- Sure-Fire Trading Systems (VectorVest, Inc.)
- Trading as a Business Workshop
- VectorVest 7 EOD
- VectorVest 7 RealTime/IntraDay
- VectorVest AutoTester
- VectorVest Educational Services
- VectorVest OnLine
- VectorVest Options Analyzer
- VectorVest ProGraphics v6.0
- VectorVest ProTrader 7
- VectorVest RealTime Derby Tool
- VectorVest Simulator
- VectorVest Variator
- VectorVest Watchdog
