HOT TOPICS LIST
- MACD
- Fibonacci
- RSI
- Gann
- ADXR
- Stochastics
- Volume
- Triangles
- Futures
- Cycles
- Volatility
- ZIGZAG
- MESA
- Retracement
- Aroon
INDICATORS LIST
LIST OF TOPICS
PRINT THIS ARTICLE
by David Penn
"E" may stand for effort. But shares of Electronics for Imaging, Inc. (EFII) have corrected sharply after three attempts to close above 30.
Position: N/A
David Penn
Technical Writer for Technical Analysis of STOCKS & COMMODITIES magazine, Working-Money.com, and Traders.com Advantage.
PRINT THIS ARTICLE
HEAD & SHOULDERS
Electronics for Imaging's Head and Shoulders Top
07/16/01 01:40:58 PMby David Penn
"E" may stand for effort. But shares of Electronics for Imaging, Inc. (EFII) have corrected sharply after three attempts to close above 30.
Position: N/A
| While it is true that there are three directions in which a stock can go (up, down and nowhere), it sometimes seems to be the case that the more a stock tries to go up and fails to go up, the more likely that stock is to come down. And come down hard. EFII has had a great run in 2001. Breaking out of a consolidation range in December 2000, shares climbed 96% from 15 to 29.5 by mid-May 2001. Unfortunately, the correction that shaved nine points from that high was a harbinger of further difficulty for EFII. |
| This is what we see in successful head and shoulders and other bearish top formations: rallies enjoined by fewer and fewer buyers, and corrections that are sharper and sharper each time the rally fails to take out an old high. Sometimes the sharpness of the correction is revealed in the higher volume during down days compared to up days. Other times the sharpness of the correction shows up in the form of gaps as prices beat a hasty retreat from unexplored high territory. In any case, corrections that are sharper and more powerful than the rallies that precede them are often indications that, rather than a momentary pause in an advancing stock, the stock may indeed have topped for the time being. |

|
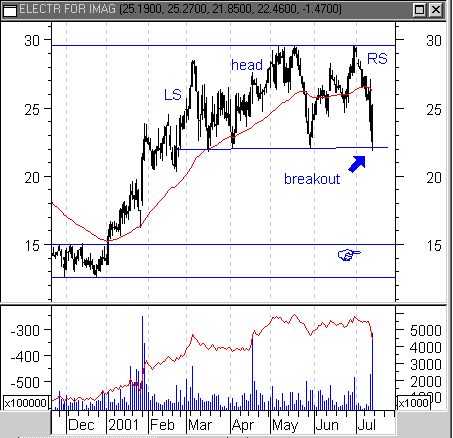
| Figure 1: Failed attempts to take out 30 and a drop beneath the stock's 50-day moving average may mean more declines are in store for EFII. |
| Graphic provided by: MetaStock. |
| |
| It appears as if EFII is fitting all of these conditions. Alerted to EFII as a stock that was experiencing unusually high selling volume (most stock screens can help spot these conditions), I found not only a stock that was moving downward quickly on big volume, but also a stock that had spent the past four and a half months trying to make a new high above 30. These failed rally attempts have come in the form of a head and shoulders top, though the peak at the end of the April rally is only marginally higher than peaks at the top of the February and June rallies. Nevertheless, the repeated failure to establish the new high at 30, as well as the sharp nature of the July correction, make further declines in EFII more likely in the near term than advances. |
| How much further? Shares of EFII could trade in the mid-teens if the topping action from March through June holds true to form. EFII closed half a point above a support area at 22 on Friday, and the support between 22 and 14 is relatively weak. Such a decline would represent about a 35% drop in EFII from the neckline at 22. |
| Even if EFII does not suffer the declines suggested by its toppish price action, renewed upside movement looks unlikely. A major consolidation area from March and April (and a higher consolidation area between April and May) might prove to be nearly insurmountable resistance should EFII slip as low as the high teens before attempting to rally. EFII may or may not make the bears' day. But its recent price action could be considered a warning for EFII bulls. |
Technical Writer for Technical Analysis of STOCKS & COMMODITIES magazine, Working-Money.com, and Traders.com Advantage.
| Title: | Technical Writer |
| Company: | Technical Analysis, Inc. |
| Address: | 4757 California Avenue SW |
| Seattle, WA 98116 | |
| Phone # for sales: | 206 938 0570 |
| Fax: | 206 938 1307 |
| Website: | www.Traders.com |
| E-mail address: | DPenn@traders.com |
Traders' Resource Links | |
| Charting the Stock Market: The Wyckoff Method -- Books | |
| Working-Money.com -- Online Trading Services | |
| Traders.com Advantage -- Online Trading Services | |
| Technical Analysis of Stocks & Commodities -- Publications and Newsletters | |
| Working Money, at Working-Money.com -- Publications and Newsletters | |
| Traders.com Advantage -- Publications and Newsletters | |
| Professional Traders Starter Kit -- Software | |
Click here for more information about our publications!
Comments

|

Request Information From Our Sponsors
- StockCharts.com, Inc.
- Candle Patterns
- Candlestick Charting Explained
- Intermarket Technical Analysis
- John Murphy on Chart Analysis
- John Murphy's Chart Pattern Recognition
- John Murphy's Market Message
- MurphyExplainsMarketAnalysis-Intermarket Analysis
- MurphyExplainsMarketAnalysis-Visual Analysis
- StockCharts.com
- Technical Analysis of the Financial Markets
- The Visual Investor
- VectorVest, Inc.
- Executive Premier Workshop
- One-Day Options Course
- OptionsPro
- Retirement Income Workshop
- Sure-Fire Trading Systems (VectorVest, Inc.)
- Trading as a Business Workshop
- VectorVest 7 EOD
- VectorVest 7 RealTime/IntraDay
- VectorVest AutoTester
- VectorVest Educational Services
- VectorVest OnLine
- VectorVest Options Analyzer
- VectorVest ProGraphics v6.0
- VectorVest ProTrader 7
- VectorVest RealTime Derby Tool
- VectorVest Simulator
- VectorVest Variator
- VectorVest Watchdog
