HOT TOPICS LIST
- MACD
- Fibonacci
- RSI
- Gann
- ADXR
- Stochastics
- Volume
- Triangles
- Futures
- Cycles
- Volatility
- ZIGZAG
- MESA
- Retracement
- Aroon
INDICATORS LIST
LIST OF TOPICS
PRINT THIS ARTICLE
by James Kupfer
Are commodities finally a buy?
Position: Accumulate
James Kupfer
Mr. Kupfer is a market professional and amateur stock market commentator. Disclosure: It is likely that Mr. Kupfer has or will enter a position in any security he writes about.
PRINT THIS ARTICLE
STOCHASTICS
Commodity Update
11/26/08 08:49:41 AMby James Kupfer
Are commodities finally a buy?
Position: Accumulate
| For almost two months, I have been trying to pick a bottom in the commodity markets, without much success. By looking at the components of the CRB, we can get better insights as to when the bounce will finally arrive or if it is here already. |

|
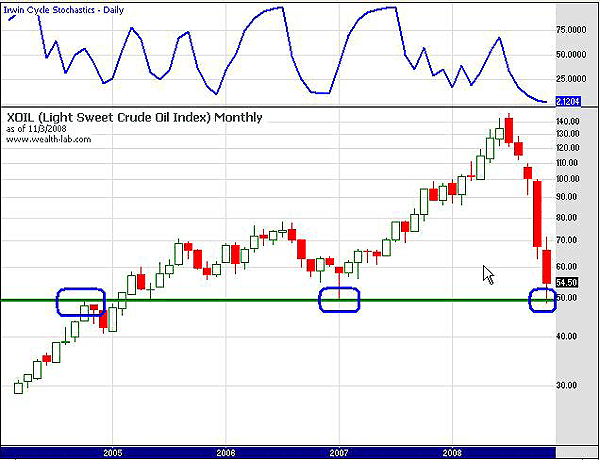
| FIGURE 1: XOIL, MONTHLY. Previous support level is shown with a green line. Note stochastics are at very low levels. |
| Graphic provided by: Wealth-lab. |
| |
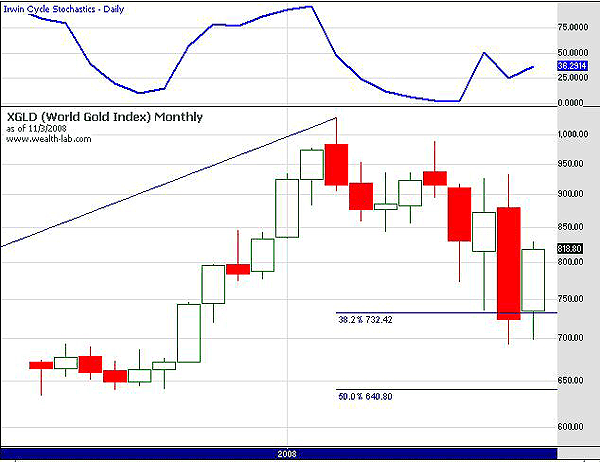
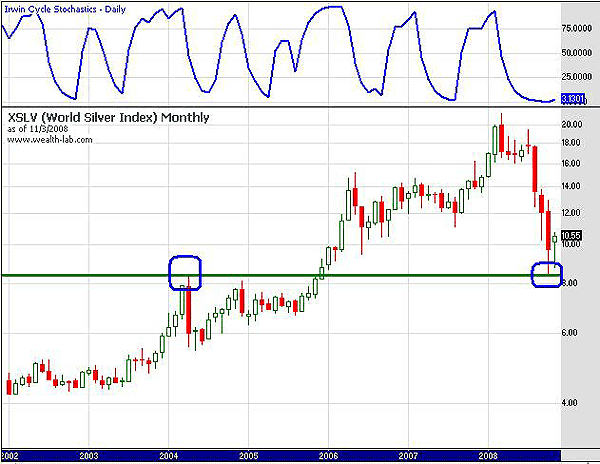
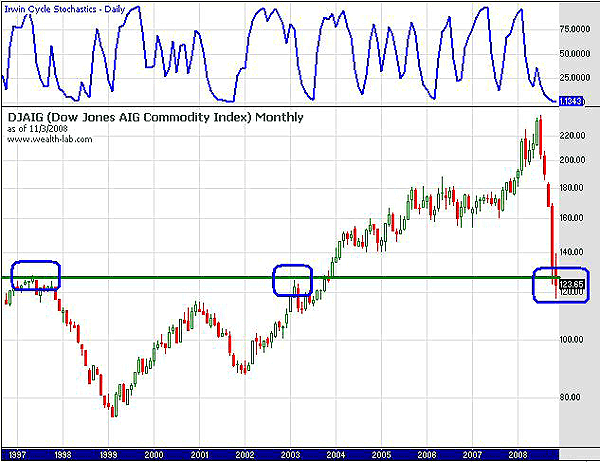
| Figures 1 through 4 are all monthly charts that allow you to see the big picture action. With the exception of gold (Figure 2), which is starting to advance nicely, all the other charts look remarkably similar — a sharp price drop over the last few months has put the indexes into very oversold states, and they are all off their lows after having hit a major support level. |

|
| FIGURE 2: XGLD, MONTHLY. Gold has already started to move up strongly. |
| Graphic provided by: Wealth-lab. |
| |
| While being oversold does not mean these tradables cannot go lower, it does point to an increased possibility that a bottom is near. In addition, the fact that almost all the major commodities have bounced off long-term support provides another piece of supportive evidence that a significant bottom is in the making. |

|
| FIGURE 3: XSLV, MONTHLY. Previous support level is shown with a green line. Note stochastics are at very low levels. |
| Graphic provided by: Wealth-lab. |
| |

|
| FIGURE 4: DJAIG, MONTHLY. Previous support level is shown with a green line. Price is slightly below support. Note that stochastics are at very low levels. |
| Graphic provided by: Wealth-lab. |
| |
Mr. Kupfer is a market professional and amateur stock market commentator. Disclosure: It is likely that Mr. Kupfer has or will enter a position in any security he writes about.
Click here for more information about our publications!
PRINT THIS ARTICLE

|

Request Information From Our Sponsors
- StockCharts.com, Inc.
- Candle Patterns
- Candlestick Charting Explained
- Intermarket Technical Analysis
- John Murphy on Chart Analysis
- John Murphy's Chart Pattern Recognition
- John Murphy's Market Message
- MurphyExplainsMarketAnalysis-Intermarket Analysis
- MurphyExplainsMarketAnalysis-Visual Analysis
- StockCharts.com
- Technical Analysis of the Financial Markets
- The Visual Investor
- VectorVest, Inc.
- Executive Premier Workshop
- One-Day Options Course
- OptionsPro
- Retirement Income Workshop
- Sure-Fire Trading Systems (VectorVest, Inc.)
- Trading as a Business Workshop
- VectorVest 7 EOD
- VectorVest 7 RealTime/IntraDay
- VectorVest AutoTester
- VectorVest Educational Services
- VectorVest OnLine
- VectorVest Options Analyzer
- VectorVest ProGraphics v6.0
- VectorVest ProTrader 7
- VectorVest RealTime Derby Tool
- VectorVest Simulator
- VectorVest Variator
- VectorVest Watchdog
