HOT TOPICS LIST
- MACD
- Fibonacci
- RSI
- Gann
- ADXR
- Stochastics
- Volume
- Triangles
- Futures
- Cycles
- Volatility
- ZIGZAG
- MESA
- Retracement
- Aroon
INDICATORS LIST
LIST OF TOPICS
PRINT THIS ARTICLE
by Donald W. Pendergast, Jr.
Gold is back, screaming upward in the wake of even more government bailouts, which many believe will lead to much higher inflation in the years to come. Royal Gold is the leader of the pack in the gold mining industry group, currently outperforming every other stock, exchange traded fund, mutual fund, and commodity linked to gold.
Position: Accumulate
Donald W. Pendergast, Jr.
Donald W. Pendergast is a financial markets consultant who offers specialized services to stock brokers and high net worth individuals who seek a better bottom line for their portfolios.
PRINT THIS ARTICLE
GOLD & METALS
Royal Gold Outperforming Its Peers
11/25/08 09:42:49 AMby Donald W. Pendergast, Jr.
Gold is back, screaming upward in the wake of even more government bailouts, which many believe will lead to much higher inflation in the years to come. Royal Gold is the leader of the pack in the gold mining industry group, currently outperforming every other stock, exchange traded fund, mutual fund, and commodity linked to gold.
Position: Accumulate
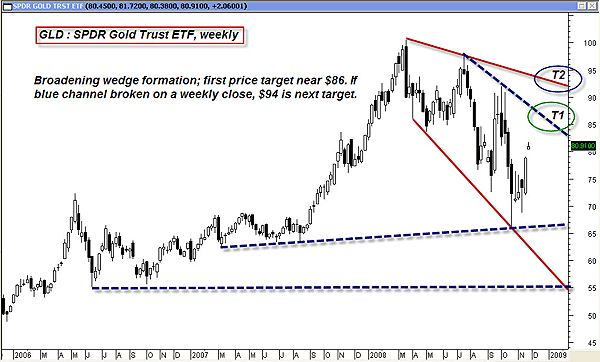
| Gold has rebounded strongly since it briefly dipped into the sub-$700 zone a month ago. Since then, price has surged past $800 as further government bailouts for troubled US banks and industries have been approved. Figure 1, the weekly chart of GLD, the SPDR Gold Trust ETF, shows just how volatile the gold market has become over the past eight months. Right now, a large broadening wedge pattern is in formative stages, and the action seems to show GLD on course for a potential tag of target 1 (T1), the upper blue channel line, right near $85–86. If GLD has enough strength to close above that channel line, the next logical target is T2, currently projected to be near $92–94. Of course, if these price levels are reached, Royal Gold should also enjoy the ride higher. Let's look at a couple of RGLD charts and see if we can establish some price targets for this, the strongest relative strength stock in the gold mining industry group. |

|
| FIGURE 1: GLD, WEEKLY. A broadening wedge begins to take shape; T1 is the logical target if the current swing continues higher. |
| Graphic provided by: MetaStock. |
| |
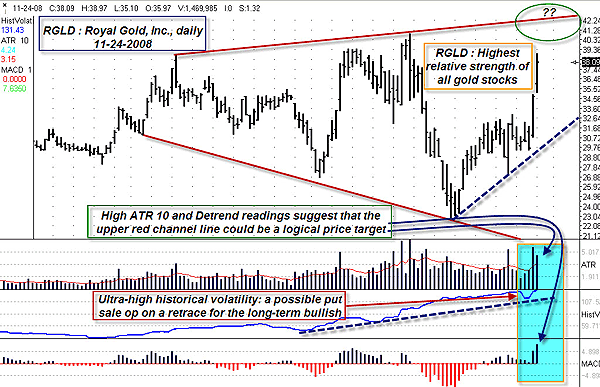
| Figure 2, a daily chart of RGLD, depicts the large broadening wedge pattern that also lends itself to logical price-target projections. The upper red channel line currently projects a target price of approximately $42–43 for RGLD; given the sheer power of the reversal move higher, it's not inconceivable that RGLD could meet the target zone in a few more sessions. In addition, note that the average true range (ATR 10) of the last 10 bars is very high even as the detrend oscillator is very high. They can always go higher, of course, but given their current levels, the $42–43 target appears to be a logical area where the current swing may pause to rest and/or retrace some of the recent gains. Historical volatility (the blue line in the second subwindow) is extremely high for RGLD, potentially offering nimble, long-term gold bulls the opportunity to sell overvalued put options on a potential retracement move. |

|
| FIGURE 2: RGLD, DAILY. Ultrahigh volatility readings are reflected by the recent round of sharp reversals. |
| Graphic provided by: Ensign Windows. |
| |
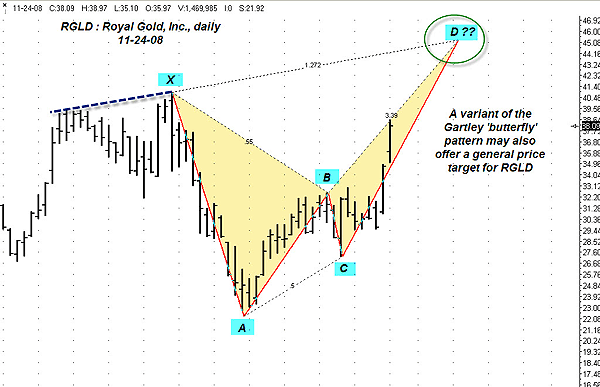
| Finally, the most interesting chart of the bunch, a daily RGLD chart featuring a variation of the famous Gartley butterfly pattern (Figure 3). The Gartley butterfly is based on a pattern where the ratio of the AB and CD swings are in proportion in both time and price. For example, the number of price bars forming the AB swing is 0.667 of the number of price bars forming the anticipated CD swing, not too far from an ideal 0.618 Fibonacci ratio. Swing CD is anticipated to stall at or before the 1.272 extension of swing XA, thus the complete, anticipated butterfly pattern formation. The pattern also provides us with a higher anticipated price target of approximately $45, slightly higher than that of the broadening wedge pattern in Figure 2. Understand that the interpretation of these patterns is as much art as it is science; after learning to identify them, however, you'll develop a sense for what looks right and what doesn't. Always confirm the patterns with other technical tools that can help provide additional confirmation. |

|
| FIGURE 3: RGLD, DAILY. The Gartley butterfly pattern. When proportioned correctly, it can be very useful in anticipating reversal points. |
| Graphic provided by: Ensign WIndows. |
| |
| Identifying price patterns such as the broadening wedge and the butterfly can help you anticipate significant resistance and/or reversal targets, well in advance of such anticipated events. For better results, always use a variety of technical tools to assist in confirming such patterns, always being aware that technical analysis is at least as much art and intuition as it is science. |
Donald W. Pendergast is a financial markets consultant who offers specialized services to stock brokers and high net worth individuals who seek a better bottom line for their portfolios.
| Title: | Writer, market consultant |
| Company: | Linear Trading Systems LLC |
| Jacksonville, FL 32217 | |
| Phone # for sales: | 904-239-9564 |
| E-mail address: | lineartradingsys@gmail.com |
Traders' Resource Links | |
| Linear Trading Systems LLC has not added any product or service information to TRADERS' RESOURCE. | |
Click here for more information about our publications!
Comments
Date: 11/30/08Rank: 4Comment:

Request Information From Our Sponsors
- VectorVest, Inc.
- Executive Premier Workshop
- One-Day Options Course
- OptionsPro
- Retirement Income Workshop
- Sure-Fire Trading Systems (VectorVest, Inc.)
- Trading as a Business Workshop
- VectorVest 7 EOD
- VectorVest 7 RealTime/IntraDay
- VectorVest AutoTester
- VectorVest Educational Services
- VectorVest OnLine
- VectorVest Options Analyzer
- VectorVest ProGraphics v6.0
- VectorVest ProTrader 7
- VectorVest RealTime Derby Tool
- VectorVest Simulator
- VectorVest Variator
- VectorVest Watchdog
- StockCharts.com, Inc.
- Candle Patterns
- Candlestick Charting Explained
- Intermarket Technical Analysis
- John Murphy on Chart Analysis
- John Murphy's Chart Pattern Recognition
- John Murphy's Market Message
- MurphyExplainsMarketAnalysis-Intermarket Analysis
- MurphyExplainsMarketAnalysis-Visual Analysis
- StockCharts.com
- Technical Analysis of the Financial Markets
- The Visual Investor
