HOT TOPICS LIST
- MACD
- Fibonacci
- RSI
- Gann
- ADXR
- Stochastics
- Volume
- Triangles
- Futures
- Cycles
- Volatility
- ZIGZAG
- MESA
- Retracement
- Aroon
INDICATORS LIST
LIST OF TOPICS
PRINT THIS ARTICLE
by Koos van der Merwe
How long till the bottom?
Position: Accumulate
Koos van der Merwe
Has been a technical analyst since 1969, and has worked as a futures and options trader with First Financial Futures in Johannesburg, South Africa.
PRINT THIS ARTICLE
ELLIOTT WAVE
Torrential Toronto TSX300 Index Troubles
11/26/08 11:43:49 AMby Koos van der Merwe
How long till the bottom?
Position: Accumulate
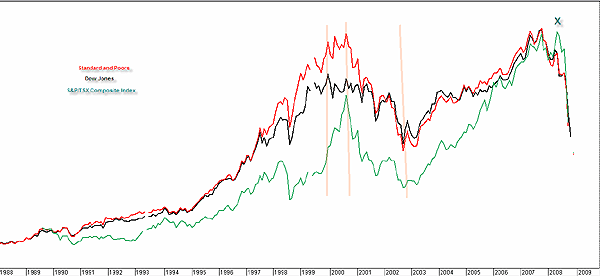
| Over the past year's economic meltdown, Canada has been looked at as a guiding light. The banks, although suffering from problems (with TD Bank being the latest to admit to difficulties), have withstood the huge losses that US banks have suffered. When the Dow Jones Industrial Average (DJIA) and Standard & Poor's 500 started collapsing, the TSX 300 soared, but with the fall in the price of oil, and the virtual collapse in the primary metals market, the TSX 300 started falling dramatically, and far faster than its US counterparts. Figure 1 is the TSX 300 with the DJIA and the S&P 500 superimposed. |

|
| FIGURE 1: TSX. Here's the trend of the TSX relative to the DJIA and the S&P 500. |
| Graphic provided by: MetaStock. |
| |
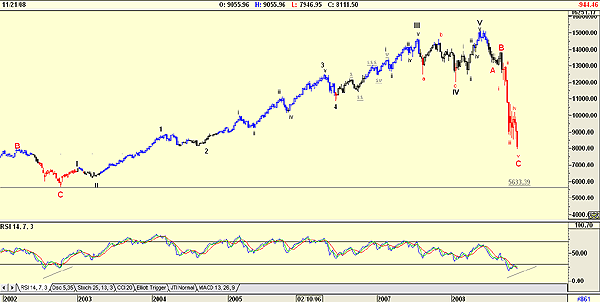
| Note how closely the movement of the TSX relates more to the S&P 500 than to the DJIA, probably because the DJIA is only 30 stocks whereas the TSX is 300 and the S&P is 500. However, note how both the S&P and the DJIA fell away, and the TSX followed only four months later as the oil price started to fall. Figure 2 is a weekly chart of the TSX 300. The chart shows my Elliott wave count and suggests that TSX could be finalizing a wave C bottom. This is suggested by the relative strength index (RSI), which is at oversold levels. |

|
| FIGURE 2: TSX, WEEKLY. Here's the Elliott wave count, which suggests that TSX could be finalizing a wave C bottom. |
| Graphic provided by: MetaStock. |
| |
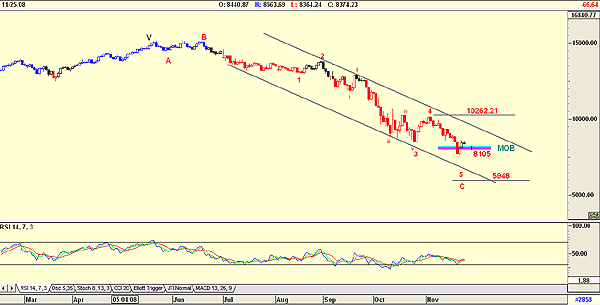
| C-wave bottoms are notoriously difficult to forecast, because too much emotion exists in the market. As the year nears its end, tax-loss selling increases, depressing the market even further. The Advanced GET program does offer the make or break (MOB) strategy as a way of trying to guess where the bottom/top will be. Applied to the low of wave 3 of wave C, it suggests a target of 8105. However, if the index breaks below the MOB line, then the target is the distance from the top of wave 4 to the MOB line subtracted from the MOB line. The chart shows the target as 5948 (10262 - 8105 = 2157, 8105 - 2157 = 5948). With emotion running high, and with tax-loss selling, we could even see this target penetrated in a V bottom -- that is, where there is a strong fall followed by a strong recovery. Figure 3 shows the two targets that could hopefully signify the C-wave bottom, and the end of the bear market for the TSX 300. |

|
| FIGURE 3: TSX, DAILY. Here are the two targets that could signify the C-wave bottom. |
| Graphic provided by: MetaStock. |
| |
| These charts show how the Canadian stock market, despite being heavily weighted in favor of oil and precious metals minerals mining stocks, strongly follow the trend of the US stock indexes. The target shown of 5994 is very feasible. Hopefully, the index will bottom before this level is reached, and many will again start sleeping at night. |
Has been a technical analyst since 1969, and has worked as a futures and options trader with First Financial Futures in Johannesburg, South Africa.
| Address: | 3256 West 24th Ave |
| Vancouver, BC | |
| Phone # for sales: | 6042634214 |
| E-mail address: | petroosp@gmail.com |
Click here for more information about our publications!
PRINT THIS ARTICLE

Request Information From Our Sponsors
- VectorVest, Inc.
- Executive Premier Workshop
- One-Day Options Course
- OptionsPro
- Retirement Income Workshop
- Sure-Fire Trading Systems (VectorVest, Inc.)
- Trading as a Business Workshop
- VectorVest 7 EOD
- VectorVest 7 RealTime/IntraDay
- VectorVest AutoTester
- VectorVest Educational Services
- VectorVest OnLine
- VectorVest Options Analyzer
- VectorVest ProGraphics v6.0
- VectorVest ProTrader 7
- VectorVest RealTime Derby Tool
- VectorVest Simulator
- VectorVest Variator
- VectorVest Watchdog
- StockCharts.com, Inc.
- Candle Patterns
- Candlestick Charting Explained
- Intermarket Technical Analysis
- John Murphy on Chart Analysis
- John Murphy's Chart Pattern Recognition
- John Murphy's Market Message
- MurphyExplainsMarketAnalysis-Intermarket Analysis
- MurphyExplainsMarketAnalysis-Visual Analysis
- StockCharts.com
- Technical Analysis of the Financial Markets
- The Visual Investor
