

HOT TOPICS LIST
- MACD
- Fibonacci
- RSI
- Gann
- ADXR
- Stochastics
- Volume
- Triangles
- Futures
- Cycles
- Volatility
- ZIGZAG
- MESA
- Retracement
- Aroon
INDICATORS LIST
LIST OF TOPICS
PRINT THIS ARTICLE
by Alan R. Northam
XLF has now completed all the Elliott wave rules and guidelines for the completion of the ABC zigzag market correction. The financial market could be on the cusp of a new bull market.
Position: N/A
Alan R. Northam
Alan Northam lives in the Dallas, Texas area and as an electronic engineer gave him an analytical mind from which he has developed a thorough knowledge of stock market technical analysis. His abilities to analyze the future direction of the stock market has allowed him to successfully trade of his own portfolio over the last 30 years. Mr. Northam is now retired and trading the stock market full time. You can reach him at inquiry@tradersclassroom.com or by visiting his website at http://www.tradersclassroom.com. You can also follow him on Twitter @TradersClassrm.
PRINT THIS ARTICLE
ELLIOTT WAVE
Financial Select Sector Completing Final Leg Down
11/26/08 03:51:00 AMby Alan R. Northam
XLF has now completed all the Elliott wave rules and guidelines for the completion of the ABC zigzag market correction. The financial market could be on the cusp of a new bull market.
Position: N/A
| According to Elliott wave theory, once a market makes a major market top, that market will correct in three waves. These three waves have been defined by Elliott wave as an ABC zigzag. In the case where the market made a major bull market top, an ABC zigzag unfolds as five waves down forming wave (A), three waves up forming wave (B), followed by a final five waves down that forms wave (C). Upon completion of the ABC zigzag correction, Elliott wave theory further states that a new market trend will develop in the opposite direction of the ABC zigzag. |
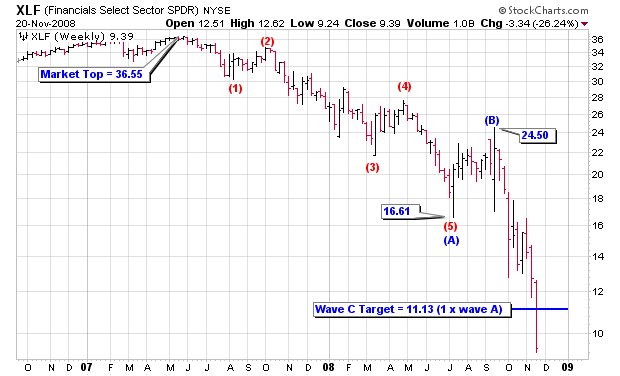
| Figure 1 shows the weekly bar chart of the Financial Select SPDR (XLF). This chart shows that XLF made a major bull market top in May 2007. Since that time, XLF has unfolded in five nonoverlapping waves, forming wave (A), obeying all the rules of the Elliott wave theory. In addition to completing wave (A) of an ABC zigzag, XLF has also completed wave (B). This leaves the final wave (C) to complete the ABC zigzag. To calculate a high-probability price target for the completion of wave (C), divide the price at the market top (36.55) from the price minimum at the completion of wave (A) (16.61). Then divide this quotient into the price maximum of wave (B) (24.50) to arrive at a price target of $11.13 for the completion of wave (C). |
|
| FIGURE 1: XLF, WEEKLY. This figure shows the Elliott wave count and also shows the price target for the completion of wave (C), which also completes the ABC zigzag market correction. |
| Graphic provided by: StockCharts.com. |
| |
| Elliott waves sometimes have a tendency to alternate. In the case of an ABC zigzag, this means that if wave (A) unfolds slowly so that its subwave divisions can be counted, then wave (C) may develop quickly in such a way that its subwaves cannot be counted without changing to a smaller time frame. This appears to be the case with the ABC zigzag corrective formation for XLF. Wave (A) took approximately one year to unfold and its five subwaves have been counted. Wave (C) on the other hand has unfolded and met its price target within nine weeks and its subwaves cannot be counted on the weekly bar chart. |
|
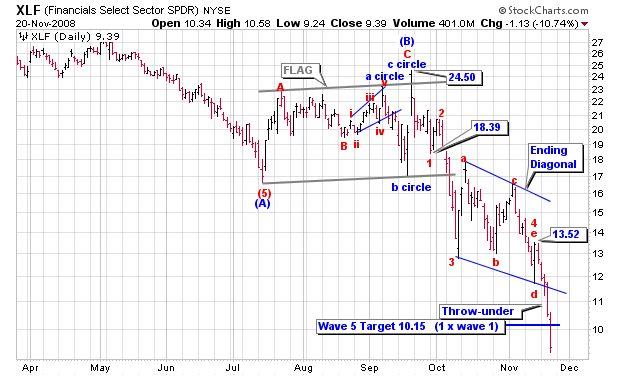
| FIGURE 2: XLF, DAILY. This chart shows the Elliott wave count of XLF and shows the price target for the completion of wave 5 of wave (C). |
| Graphic provided by: StockCharts.com. |
| |
| Figure 2 shows the daily bar chart of XLF. This chart shows that wave (C) has unfolded in five waves, waves 1, 2, 3, and 4, with wave 5 yet to be completed. To calculate a high-probability price target for the completion of wave 5, take the maximum price of wave (B) (24.50), and divide it by the minimum price of wave 1 (18.39). Take this quotient and divide it into the price maximum of wave 4 (13.52) to arrive at a target price of 10.15. Note that this target price is a little lower than the price target calculated from the weekly chart. This is known as a price cluster. A price cluster is a range of prices for the same target price that has been derived by various methods. A price cluster is a higher-probability price target than a single calculated price target. Therefore, the range from between 11.13 and 10.15 is a high-probability price range for the completion of wave 5, which also then completes the final wave (C) of the ABC zigzag market correction. However, the question remains is wave 5 complete. To answer this question, we must once again look at a smaller time frame. |
|
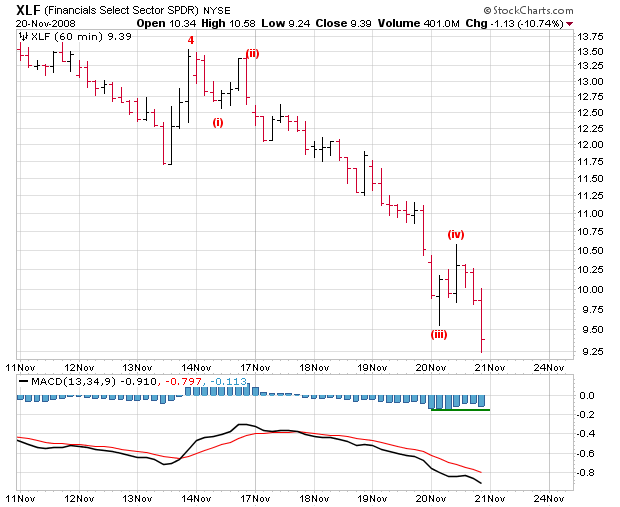
| FIGURE 3: XLF, HOURLY. The 60-minute price chart of XLF showing the subwaves of wave 5. This chart also shows the MACD measuring momentum. Momentum is slowing down and is signaling a high probability for a change in direction. |
| Graphic provided by: StockCharts.com. |
| |
| Figure 3 shows the 60-minute bar chart of XLF. This chart shows that wave 5 has unfolded in five subwaves, subwave (i), (ii), (iii), (iv), with subwave (v) still unfolding. I have also shown the moving average convergence/divergence (MACD) along with its histogram. The MACD is used to measure momentum and is based upon two moving averages, the 13-day moving average and the 34-day moving average. When these two moving averages start to converge on each other, it is a signal that momentum is starting to slow down. To better see the results of these two moving averages converging on each other, a histogram that measures the difference between these two moving averages is shown. As you can see, the histogram bars are starting to get shorter and this is an indication that the two moving averages are converging and momentum is slowing down. Momentum normally slows down just before a trend reversal. So, MACD is signaling that XLF may very well be close to completing subwave (v), which will then complete wave 5, which will then complete wave (C) and the ABC zigzag market correction. What we need to watch for now is a signal that tells us that subwave (v) is now complete. While there are many ways to do this, one simple way is to watch for the MACD line to cross above its zero line. This normally occurs after the trend has changed directions and is a signal that subwave (v) is complete and a new market trend is under way. In conclusion, according to my analysis of the Elliott wave count for XLF, the financial market sector is on the cusp of completing its downward market correction. According to the Elliott wave theory, all the rules and guidelines have been met for the completion of this market correction. All that needs to occur now is for a major trend reversal pattern to evolve that will signal the market correction, which started over a year ago, has come to an end. Following this major trend reversal signal, the financial sector should launch a new bull market. However, the cautious trader will continue to treat this market as a market correction until a major trend reversal pattern has developed. |
Alan Northam lives in the Dallas, Texas area and as an electronic engineer gave him an analytical mind from which he has developed a thorough knowledge of stock market technical analysis. His abilities to analyze the future direction of the stock market has allowed him to successfully trade of his own portfolio over the last 30 years. Mr. Northam is now retired and trading the stock market full time. You can reach him at inquiry@tradersclassroom.com or by visiting his website at http://www.tradersclassroom.com. You can also follow him on Twitter @TradersClassrm.
| Garland, Tx | |
| Website: | www.tradersclassroom.com |
| E-mail address: | inquiry@tradersclassroom.com |
Click here for more information about our publications!
Comments
Date:�12/03/08Rank:�5Comment:�

Request Information From Our Sponsors
- StockCharts.com, Inc.
- Candle Patterns
- Candlestick Charting Explained
- Intermarket Technical Analysis
- John Murphy on Chart Analysis
- John Murphy's Chart Pattern Recognition
- John Murphy's Market Message
- MurphyExplainsMarketAnalysis-Intermarket Analysis
- MurphyExplainsMarketAnalysis-Visual Analysis
- StockCharts.com
- Technical Analysis of the Financial Markets
- The Visual Investor
- VectorVest, Inc.
- Executive Premier Workshop
- One-Day Options Course
- OptionsPro
- Retirement Income Workshop
- Sure-Fire Trading Systems (VectorVest, Inc.)
- Trading as a Business Workshop
- VectorVest 7 EOD
- VectorVest 7 RealTime/IntraDay
- VectorVest AutoTester
- VectorVest Educational Services
- VectorVest OnLine
- VectorVest Options Analyzer
- VectorVest ProGraphics v6.0
- VectorVest ProTrader 7
- VectorVest RealTime Derby Tool
- VectorVest Simulator
- VectorVest Variator
- VectorVest Watchdog