

HOT TOPICS LIST
- MACD
- Fibonacci
- RSI
- Gann
- ADXR
- Stochastics
- Volume
- Triangles
- Futures
- Cycles
- Volatility
- ZIGZAG
- MESA
- Retracement
- Aroon
INDICATORS LIST
LIST OF TOPICS
PRINT THIS ARTICLE
by Alan R. Northam
The flag formation for SSRI has failed and signals that the SSRI will continue to trade lower in the short term. However, the short-term upward trend for SSRI should resume once this correction is complete.
Position: N/A
Alan R. Northam
Alan Northam lives in the Dallas, Texas area and as an electronic engineer gave him an analytical mind from which he has developed a thorough knowledge of stock market technical analysis. His abilities to analyze the future direction of the stock market has allowed him to successfully trade of his own portfolio over the last 30 years. Mr. Northam is now retired and trading the stock market full time. You can reach him at inquiry@tradersclassroom.com or by visiting his website at http://www.tradersclassroom.com. You can also follow him on Twitter @TradersClassrm.
PRINT THIS ARTICLE
FLAGS AND PENNANTS
Silver Standard Resources Flag Breakdown
11/21/08 11:57:48 AMby Alan R. Northam
The flag formation for SSRI has failed and signals that the SSRI will continue to trade lower in the short term. However, the short-term upward trend for SSRI should resume once this correction is complete.
Position: N/A
| On November 11, I published an article entitled "Silver Standard Resources Bouncing Off Support." In that article I showed that a flag was forming on the 60-minute chart. Flag patterns are normally continuation patterns and the flag for Silver Standard Resources was signaling the continuation of the rally in the upward direction. However, since then the flag formation has failed and so I thought it prudent to update that article. |
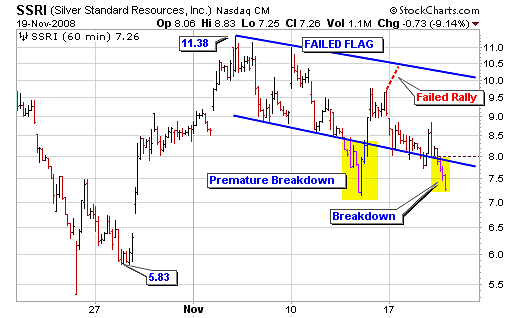
| Figure 1 shows a 60-minute bar chart of Silver Standard Resources (SSRI). This chart is an updated version of the chart shown in my previous article. This chart shows that from the low in October to the high in early November, SSRI rallied in an impulsive way. An impulsive rally defines the main direction of the trend. In this case, the rally from mid-October to early November defines that the short-term direction is up. Note that the upward trend is defined as a short-term trend since our time frame is referenced to the 60-minute chart. In addition, note that the rally is defined as an impulsive rally because the subwaves within this rally are nonoverlapping waves. This definition is taken from the Elliott wave theory. |
|
| FIGURE 1: SSRI, HOURLY. This chart shows the impulse market rally from mid-October to early November. This chart also shows the failed flag formation. |
| Graphic provided by: StockCharts.com. |
| |
| However, the selloff from early November forward is corrective. Corrective waves are identified by a shallow sloping trend and each wave within this trend is overlapping. Again, this is taken from the Elliott wave theory. From classical or traditional technical analysis, this corrective wave started out by looking like a flag. A flag is a pattern that develops against the main trend and is composed of a trading range between two shallow downward sloping lines. The bottom line is normally called a support line and the upper line is normally called a channel line or a resistance line. During the formation of the flag, it appeared as if there was a false breakdown. A false breakdown occurs when price breaks out of the flag formation and then returns and starts to trade inside the flag pattern. However, since that time SSRI has broken down a second time. Second breakdowns are normally real breakdowns, so it is highly unlikely that this second breakdown is also a false breakdown. However a quick return back to within the flag pattern would suggest that this too could be a false breakdown. With the second breakdown suspected to be a real breakdown, the market should now continue lower. Also from a technical point of view, the first breakdown has been relabeled as a premature breakdown. A premature breakdown is defined as a breakdown that quickly returns back to the flag formation and then breaks down again for the second time. |
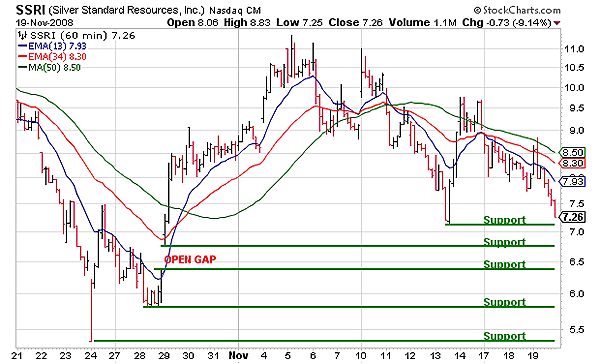
| In Figure 2, I have again shown the 60-minute chart for SSRI. This chart shows the possible areas of support that could end the corrective selloff of SSRI. Any one of these lines of support could stop the downward correction. It is a very difficult thing to pick which of these lines of support will be the strongest and will turn SSRI back upward. However, there are a couple of high-probability areas for strong support that should be addressed. First of all, there exists an open gap on the chart. An open gap is created when the low of a trading session's bar is higher than the high of the previous session's bar. There exists a high probability that these gaps are filled -- that is, the market will eventually come back down and trade below the low of the open gap. So look for the price to move back down to the support line drawn off the high bar of the open gap just below 6.50. Second, there is a high probability that the market will turn back upward before falling to the lowest line of support drawn off the October low. The reason is that if the rally from the October low to the early November high is impulsive, then the following market correction should not trade back below its origin. Again, this is taken from the Elliott wave theory. |
|
| FIGURE 2: SSRI, HOURLY. This chart shows possible areas of support that could end the downward selloff and turn this market back upward. A close below the October low would signal the continuation of the downward trend. |
| Graphic provided by: StockCharts.com. |
| |
| In conclusion, the market rally from mid-October to early November looks impulsive and defines the market trend as short-term upward. The selloff from early November forward looks corrective as the downward trend is shallow with overlapping waves. The corrective rally at first looked to be forming a flag, which signals a trend continuation. However, this flag formation has failed to stop the market correction and turn SSRI back upward, and therefore, the market correction continues. Market corrections normally retrace only a certain percentage of the previous rally and should come to an end before SSRI reaches the October low. Several lines of support have been identified on the bar chart that represent possible price targets that could turn this market back upward. Although it is difficult to tell which of these lines of support will turn the market back upward, there is a high probability for the market to turn back upward at the support line drawn just below 6.50 on the chart. There is also a higher probability that the market correction will end before reaching the support line drawn off the October low. A high-probability signal that will inform traders that the correction has ended and SSRI has resumed its short-term upward trend will occur when the 13-day and the 34-day moving averages cross above the 50-day moving average. Upward price targets from my previous article remain valid for the completion of the short-term upward rally. A close below the October low will signal that the main trend for SSRI is still in the downward direction. |
Alan Northam lives in the Dallas, Texas area and as an electronic engineer gave him an analytical mind from which he has developed a thorough knowledge of stock market technical analysis. His abilities to analyze the future direction of the stock market has allowed him to successfully trade of his own portfolio over the last 30 years. Mr. Northam is now retired and trading the stock market full time. You can reach him at inquiry@tradersclassroom.com or by visiting his website at http://www.tradersclassroom.com. You can also follow him on Twitter @TradersClassrm.
| Garland, Tx | |
| Website: | www.tradersclassroom.com |
| E-mail address: | inquiry@tradersclassroom.com |
Click here for more information about our publications!
Comments
Date:�11/22/08Rank:�5Comment:�How do you protect yourself with an ETF based on the S P on the short-term downturns and still make money?

Request Information From Our Sponsors
- StockCharts.com, Inc.
- Candle Patterns
- Candlestick Charting Explained
- Intermarket Technical Analysis
- John Murphy on Chart Analysis
- John Murphy's Chart Pattern Recognition
- John Murphy's Market Message
- MurphyExplainsMarketAnalysis-Intermarket Analysis
- MurphyExplainsMarketAnalysis-Visual Analysis
- StockCharts.com
- Technical Analysis of the Financial Markets
- The Visual Investor
- VectorVest, Inc.
- Executive Premier Workshop
- One-Day Options Course
- OptionsPro
- Retirement Income Workshop
- Sure-Fire Trading Systems (VectorVest, Inc.)
- Trading as a Business Workshop
- VectorVest 7 EOD
- VectorVest 7 RealTime/IntraDay
- VectorVest AutoTester
- VectorVest Educational Services
- VectorVest OnLine
- VectorVest Options Analyzer
- VectorVest ProGraphics v6.0
- VectorVest ProTrader 7
- VectorVest RealTime Derby Tool
- VectorVest Simulator
- VectorVest Variator
- VectorVest Watchdog