HOT TOPICS LIST
- MACD
- Fibonacci
- RSI
- Gann
- ADXR
- Stochastics
- Volume
- Triangles
- Futures
- Cycles
- Volatility
- ZIGZAG
- MESA
- Retracement
- Aroon
INDICATORS LIST
LIST OF TOPICS
PRINT THIS ARTICLE
by Donald W. Pendergast, Jr.
Based on chart action and COT figures, the smart money appears to be accumulating natural gas.
Position: Accumulate
Donald W. Pendergast, Jr.
Donald W. Pendergast is a financial markets consultant who offers specialized services to stock brokers and high net worth individuals who seek a better bottom line for their portfolios.
PRINT THIS ARTICLE
CHANNEL LINES
Natural Gas: One ETF Bucks Market Selloff
11/21/08 09:37:37 AMby Donald W. Pendergast, Jr.
Based on chart action and COT figures, the smart money appears to be accumulating natural gas.
Position: Accumulate
| What goes up, must come down — hard. That was certainly the case for natural gas and its exchange traded fund (ETF) cousin, the US Natural Gas ETF (UNG). Like most other commodities, the dramatic decrease in prices since early July has been anything but a joyful experience for hard-core commodity bulls. Now, however, natural gas and its related stock market offspring appear to have put in tentative bottoms as they begin to approach their upper channel boundaries. |

|
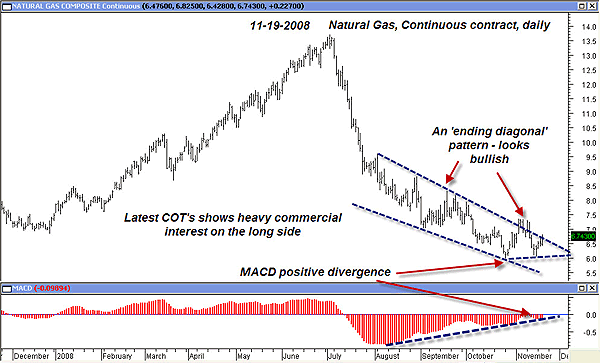
| FIGURE 1: NG, DAILY. Positive price-momentum divergence and an ending diagonal make a bullish case for natural gas. |
| Graphic provided by: MetaStock. |
| |
| The daily natural gas contract is fairly obvious in its posture — a breakout attempt is in progress (Figure 1). The long, pronounced, moving average convergence/divergence (MACD) positive price-momentum divergence laid the groundwork for the breakout attempt, as did the small, yet significant double-bottom pattern. In addition, the latest week's Commitment of Traders data shows a decided long-side bias by commercial interests — a very bullish scenario, given the action on the chart. |

|
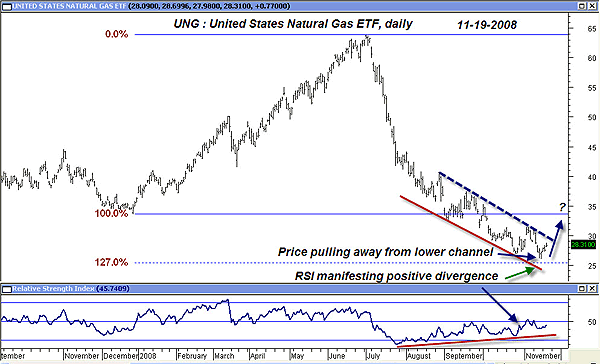
| FIGURE 2: UNG, DAILY. Price pulls away from the lower channel boundary line even as RSI displays a substantial positive price-momentum divergence. |
| Graphic provided by: MetaStock. |
| |
| Moving to the UNG daily chart (Figure 2), a similar, but slightly less bullish channel pattern also appears to be in a breakout attempt mode. UNG was one of a handful of ETFs to abstain from participation in the recent vicious broad-market selloff, lending even more credibility to the bullish chart overtones. |
| A rally in natural gas — related markets isn't that novel a concept right now; after all, it is nearly December and it's getting cold outside! The 18-year natural gas seasonal chart also shows a pronounced contract rollover spike in late November, so perhaps that's all this is — just a temporary upward price blip as longer-term traders roll their positions forward. However, given the tremendous decline from July's lofty heights, this may actually be the start of a long-awaited reaction rally, one that will retrace at least a portion of the massive drop from $13.70. Given the weight of the technical and fundamental evidence, I give both natural gas and the US Natural Gas ETFs a solid "accumulate" rating. |
Donald W. Pendergast is a financial markets consultant who offers specialized services to stock brokers and high net worth individuals who seek a better bottom line for their portfolios.
| Title: | Writer, market consultant |
| Company: | Linear Trading Systems LLC |
| Jacksonville, FL 32217 | |
| Phone # for sales: | 904-239-9564 |
| E-mail address: | lineartradingsys@gmail.com |
Traders' Resource Links | |
| Linear Trading Systems LLC has not added any product or service information to TRADERS' RESOURCE. | |
Click here for more information about our publications!
Comments
Date: 11/25/08Rank: 5Comment:

Request Information From Our Sponsors
- StockCharts.com, Inc.
- Candle Patterns
- Candlestick Charting Explained
- Intermarket Technical Analysis
- John Murphy on Chart Analysis
- John Murphy's Chart Pattern Recognition
- John Murphy's Market Message
- MurphyExplainsMarketAnalysis-Intermarket Analysis
- MurphyExplainsMarketAnalysis-Visual Analysis
- StockCharts.com
- Technical Analysis of the Financial Markets
- The Visual Investor
- VectorVest, Inc.
- Executive Premier Workshop
- One-Day Options Course
- OptionsPro
- Retirement Income Workshop
- Sure-Fire Trading Systems (VectorVest, Inc.)
- Trading as a Business Workshop
- VectorVest 7 EOD
- VectorVest 7 RealTime/IntraDay
- VectorVest AutoTester
- VectorVest Educational Services
- VectorVest OnLine
- VectorVest Options Analyzer
- VectorVest ProGraphics v6.0
- VectorVest ProTrader 7
- VectorVest RealTime Derby Tool
- VectorVest Simulator
- VectorVest Variator
- VectorVest Watchdog
