HOT TOPICS LIST
- MACD
- Fibonacci
- RSI
- Gann
- ADXR
- Stochastics
- Volume
- Triangles
- Futures
- Cycles
- Volatility
- ZIGZAG
- MESA
- Retracement
- Aroon
INDICATORS LIST
LIST OF TOPICS
PRINT THIS ARTICLE
by Koos van der Merwe
Last week, I wrote that I believed the Dow Jones Industrial Average had bottomed, and that the bull has taken over from the bear. This week, I see no reason to change my tune.
Position: N/A
Koos van der Merwe
Has been a technical analyst since 1969, and has worked as a futures and options trader with First Financial Futures in Johannesburg, South Africa.
PRINT THIS ARTICLE
ELLIOTT WAVE
Has The NASDAQ Bull Taken Over?
11/21/08 09:28:12 AMby Koos van der Merwe
Last week, I wrote that I believed the Dow Jones Industrial Average had bottomed, and that the bull has taken over from the bear. This week, I see no reason to change my tune.
Position: N/A
| In that article, "The Dow And A Key Reversal" of November 13, I concluded by writing, "Whether this level is indeed the completion of the C-wave down will be confirmed over the next few days." The days that followed were positive, with the exception of Wednesday, November 18, when the three US automakers flew to Washington in private jets to testify in front of Congress with a tincup in each hand. However, I remain convinced that the bull is victorious, and Figure 1 shows why. |

|
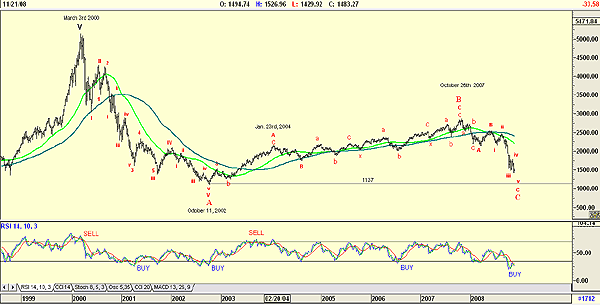
| FIGURE 1: NASDAQ, WEEKLY. The light green is a 40-period simple moving average, and the dark green is an 80-period simple moving average. |
| Graphic provided by: AdvancedGET. |
| |
| Figure 1 is a weekly chart of the NASDAQ, with my Elliott wave count and a relative strength index (RSI). There are two moving averages; the light green is a 40-period simple moving average, and the dark green is an 80-period simple moving average. I have chosen a weekly chart above a daily or monthly chart because it is an easier read. In the chart I have shown how the NASDAQ dropped to a low in October 2002, completing an A-wave, and then corrected upward in a very complicated B-wave, moving above both moving averages. The RSI has not yet given a buy signal, although it is at oversold levels. This suggests that the NASDAQ may fall further, but not by much, as it attempts to find its bottom, hopefully at the low of October 2002. Of course, in its B-wave rise, the NASDAQ never came close to its high of March 3, 2000, a high set by the dotcom bubble. This also meant that the C-wave collapse from October 2007 will not be as vicious as the Standard & Poor's 500 or the Dow Jones Industrial Average (DJIA), simply because there are no financial companies to collapse. Whether my wave count is suggesting the end of the bear is at hand for the NASDAQ or the RSI gives a positive reliable buy signal in the near future, it certainly looks as though the NASDAQ is confirming a new bull market in the near future. |
Has been a technical analyst since 1969, and has worked as a futures and options trader with First Financial Futures in Johannesburg, South Africa.
| Address: | 3256 West 24th Ave |
| Vancouver, BC | |
| Phone # for sales: | 6042634214 |
| E-mail address: | petroosp@gmail.com |
Click here for more information about our publications!
PRINT THIS ARTICLE

Request Information From Our Sponsors
- StockCharts.com, Inc.
- Candle Patterns
- Candlestick Charting Explained
- Intermarket Technical Analysis
- John Murphy on Chart Analysis
- John Murphy's Chart Pattern Recognition
- John Murphy's Market Message
- MurphyExplainsMarketAnalysis-Intermarket Analysis
- MurphyExplainsMarketAnalysis-Visual Analysis
- StockCharts.com
- Technical Analysis of the Financial Markets
- The Visual Investor
- VectorVest, Inc.
- Executive Premier Workshop
- One-Day Options Course
- OptionsPro
- Retirement Income Workshop
- Sure-Fire Trading Systems (VectorVest, Inc.)
- Trading as a Business Workshop
- VectorVest 7 EOD
- VectorVest 7 RealTime/IntraDay
- VectorVest AutoTester
- VectorVest Educational Services
- VectorVest OnLine
- VectorVest Options Analyzer
- VectorVest ProGraphics v6.0
- VectorVest ProTrader 7
- VectorVest RealTime Derby Tool
- VectorVest Simulator
- VectorVest Variator
- VectorVest Watchdog
