

HOT TOPICS LIST
- MACD
- Fibonacci
- RSI
- Gann
- ADXR
- Stochastics
- Volume
- Triangles
- Futures
- Cycles
- Volatility
- ZIGZAG
- MESA
- Retracement
- Aroon
INDICATORS LIST
LIST OF TOPICS
PRINT THIS ARTICLE
by Donald W. Pendergast, Jr.
Despite a 75% drop since October 2008, industrious traders can still find potential for gains in Southern Copper.
Position: Accumulate
Donald W. Pendergast, Jr.
Donald W. Pendergast is a financial markets consultant who offers specialized services to stock brokers and high net worth individuals who seek a better bottom line for their portfolios.
PRINT THIS ARTICLE
IMPLIED VOLATILITY
Southern Copper: High Implied Volatility Offers Opportunity
11/21/08 09:11:53 AMby Donald W. Pendergast, Jr.
Despite a 75% drop since October 2008, industrious traders can still find potential for gains in Southern Copper.
Position: Accumulate
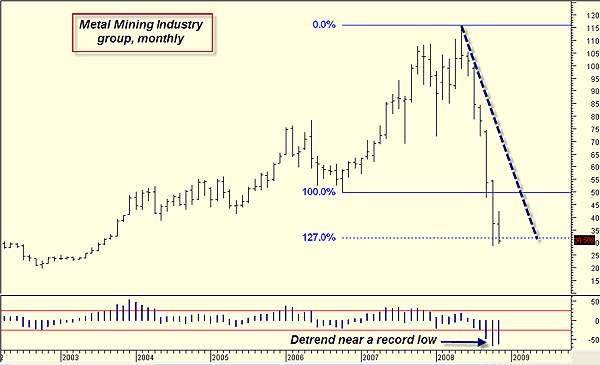
| The metal mining industry group has been hit hard over the past year. Panic liquidations fomented by the toxic, twin evils of a global credit crunch and widespread recession fear devastated anything even remotely linked to the commodities markets. The monthly chart shown in Figure 1 reveals the carnage, yet it also offers a glimmer of hope that the selling is overcooked and due for at least some semblance of a relief rally. The detrend oscillator is insanely overextended and the Fibonacci 127% extension is also acting as an ad hoc support zone —for now. Could this shell-shocked group actually offer an opportunity for a longer-term commodities bull? |
|
| FIGURE 1: METALS MINING INDUSTRY, MONTHLY. A very bad year for the metals mining industry group yields a hidden benefit — inflated option volatilities on component stocks. |
| Graphic provided by: MetaStock. |
| Graphic provided by: WB Detrend EOD from ProfitTrader for MetaStock. |
| |
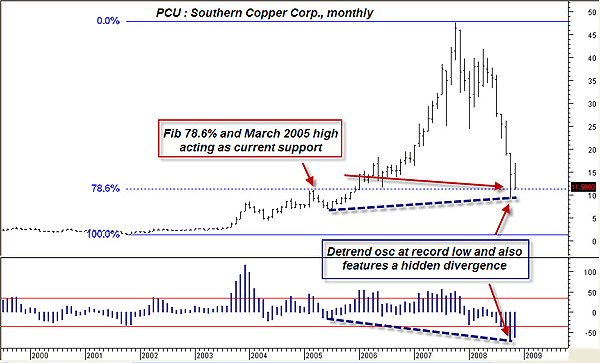
| The monthly chart of Southern Copper Corp. (PCU) is in better technical shape than its parent industry group (Figure 2). In this case, there is substantial support provided by a combination of the March 2005 high and the Fibonacci 78.6% retracement level. A bullish hidden divergence is also manifesting on the chart, a phenomenon that usually precedes a reaction move, which in PCU's case should be higher. The fact that the detrend oscillator is in record-low territory also highlights the bullish overtones. Now, whenever the detrend oscillator goes into record low territory on a monthly chart, wise traders will start to monitor option volatility to see if they can construct an option trade that will profit as volatility shrinks and/or price moves in a desired direction. Fortunately, in the case of PCU, a check of its two-year implied volatility (IV) range confirms that IV is near record levels. There are several option strategies we can focus on that profit when implied volatility falls, but this time, we'll focus on a simple strategy that may allow a long-term bullish trader to acquire PCU shares at approximately $5.50 a share in January 2010. |
|
| FIUGRE 2: PCU, MONTHLY. Bullish hidden divergence — is a reaction higher due? |
| Graphic provided by: MetaStock. |
| Graphic provided by: WB Detrend EOD from ProfitTrader for MetaStock. |
| |
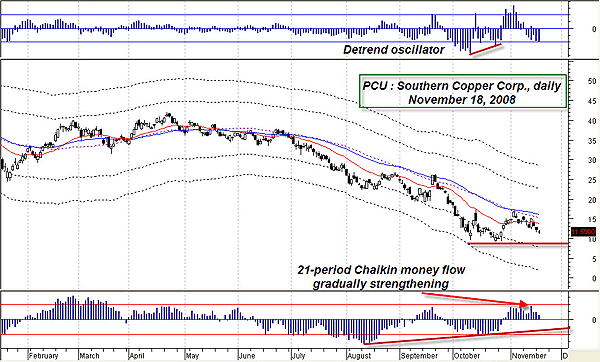
| The daily chart (Figure 3) suggests that downward momentum is nearly played out; both the detrend oscillator and the 21-period Chaikin money flow seem to agree that a low may be within striking distance. The action around the Keltner bands is also encouraging. So after evaluating the technical and fundamental evidence, our hypothetical trader decides to sell four January 2010 $7.50 put options on PCU, collecting approximately $840 in option premiums. Super-high option implied volatility results in inflated option premiums, a real advantage for put sellers looking to acquire stock at a hefty discount. Since our trader has a long-term bullish opinion on the stock, he has no problem if PCU falls below the $7.50 strike price at expiration, causing him to be assigned 400 shares of PCU. Even better, the option premiums reduce his actual basis to about $5.50 per share, if assigned! Of course, if PCU stays above $7.50 at options expiration, our trader simply keeps all of the $840 in premiums and walks away, free and clear. |
|
| FIGURE 3: PCU, DAILY. The 21-period Chaikin money flow improves even as downward momentum slows. |
| Graphic provided by: MetaStock. |
| Graphic provided by: Multi-Indicators from ProfitTrader for MetaStock. |
| |
| Are there drawbacks to selling puts on stocks? Of course! For example, the stock that you believe has finally hit bottom might just decide to fall another 50% after you've sold a put against it. Another danger is selling a put when implied volatility is at low levels; a sudden drop in the underlying stock price can rapidly inflate the value of the short put, causing you to buy it back for a heavy loss. Finally, selling put options generally requires a low initial margin, but be aware that a sudden plunge in the underlying shares will cause that to increase — sometimes dramatically. Generally speaking, selling overvalued puts on severely oversold, dividend-paying stocks with good long-term industry group fundamentals is a sound strategy, particularly if you want to acquire shares below the current market price. Paying attention to extremes in implied option volatility is the real key to success when selling puts, and it would be worth every trader's while to become better acquainted with this important market variable. |
Donald W. Pendergast is a financial markets consultant who offers specialized services to stock brokers and high net worth individuals who seek a better bottom line for their portfolios.
| Title: | Writer, market consultant |
| Company: | Linear Trading Systems LLC |
| Jacksonville, FL 32217 | |
| Phone # for sales: | 904-239-9564 |
| E-mail address: | lineartradingsys@gmail.com |
Traders' Resource Links | |
| Linear Trading Systems LLC has not added any product or service information to TRADERS' RESOURCE. | |
Click here for more information about our publications!
Comments

Request Information From Our Sponsors
- StockCharts.com, Inc.
- Candle Patterns
- Candlestick Charting Explained
- Intermarket Technical Analysis
- John Murphy on Chart Analysis
- John Murphy's Chart Pattern Recognition
- John Murphy's Market Message
- MurphyExplainsMarketAnalysis-Intermarket Analysis
- MurphyExplainsMarketAnalysis-Visual Analysis
- StockCharts.com
- Technical Analysis of the Financial Markets
- The Visual Investor
- VectorVest, Inc.
- Executive Premier Workshop
- One-Day Options Course
- OptionsPro
- Retirement Income Workshop
- Sure-Fire Trading Systems (VectorVest, Inc.)
- Trading as a Business Workshop
- VectorVest 7 EOD
- VectorVest 7 RealTime/IntraDay
- VectorVest AutoTester
- VectorVest Educational Services
- VectorVest OnLine
- VectorVest Options Analyzer
- VectorVest ProGraphics v6.0
- VectorVest ProTrader 7
- VectorVest RealTime Derby Tool
- VectorVest Simulator
- VectorVest Variator
- VectorVest Watchdog