HOT TOPICS LIST
- MACD
- Fibonacci
- RSI
- Gann
- ADXR
- Stochastics
- Volume
- Triangles
- Futures
- Cycles
- Volatility
- ZIGZAG
- MESA
- Retracement
- Aroon
INDICATORS LIST
LIST OF TOPICS
PRINT THIS ARTICLE
by Matt Blackman
China and India still enjoy respectable growth rates even as their industrialized counterparts in the US and Europe enter recession. Is now the time to jump across the bamboo curtain?
Position: N/A
Matt Blackman
Matt Blackman is a full-time technical and financial writer and trader. He produces corporate and financial newsletters, and assists clients in getting published in the mainstream media. He is the host of TradeSystemGuru.com. Matt has earned the Chartered Market Technician (CMT) designation. Find out what stocks and futures Matt is watching on Twitter at www.twitter.com/RatioTrade
PRINT THIS ARTICLE
VOLUME
Is China Set To Bounce?
11/19/08 09:33:29 AMby Matt Blackman
China and India still enjoy respectable growth rates even as their industrialized counterparts in the US and Europe enter recession. Is now the time to jump across the bamboo curtain?
Position: N/A
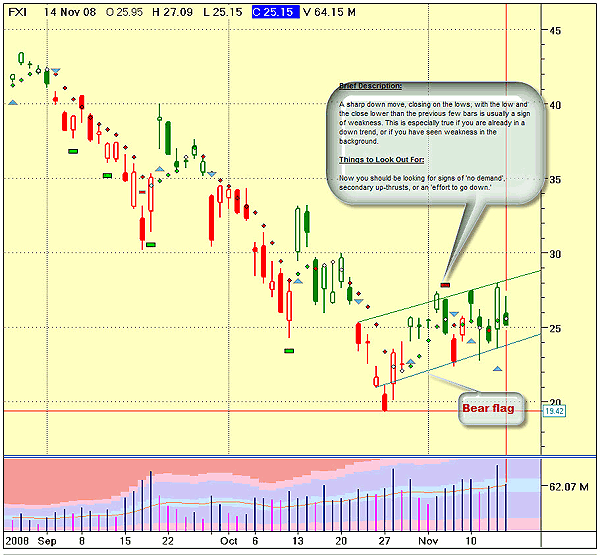
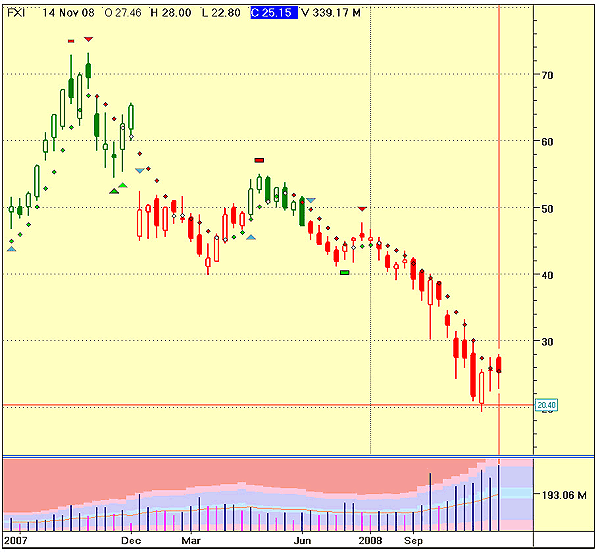
| An announcement on November 16 by Bespoke Investment Group revealed an interesting observation. China's Shanghai Composite Index, which has fallen 72% from its peak last October 2007, hit a low on November 4, 2008. The announcement noted that this index has now moved above both the top channel downtrend line and the 50-day simple moving average for the first time since January 2008. Is this a buy signal for the Chinese market? One way of playing the small but highly volatile Chinese stock market is through the iShares FTSE China exchange traded fund (ETF)(FXI). As we see from Figures 1 and 2, average daily volume is currently above 60 million shares and weekly volume nearly 200 million shares, so there is lots of liquidity. |

|
| FIGURE 1: FXI, DAILY. Note the bear flag. |
| Graphic provided by: Chart - www.TradeGuider.com, data - www.RealTimeDa. |
| |
| Figure 1 is of a daily chart of FXI, showing the smart money signals and a bear flag chart pattern. Bear flags can take weeks to form and although counter to the larger trend, they are playable on a short-term basis. In Figure 2, we see a weekly chart of FXI showing a drop from above $70 to a low of $20.40 and a recent bounce. This chart is bearish and highly oversold, suggesting that a bounce may be in the cards. But given the very high relative volume currently on both charts, this could be a capitulation, which often is a precursor to a serious bounce, at the very least. |

|
| FIGURE 2: FXI, WEEKLY. Note the major support at $20.40 accompanied by high volume. Is this an indication of capitulation? |
| Graphic provided by: Chart - www.TradeGuider.com, data - www.RealTimeDa. |
| |
Matt Blackman is a full-time technical and financial writer and trader. He produces corporate and financial newsletters, and assists clients in getting published in the mainstream media. He is the host of TradeSystemGuru.com. Matt has earned the Chartered Market Technician (CMT) designation. Find out what stocks and futures Matt is watching on Twitter at www.twitter.com/RatioTrade
| Company: | TradeSystemGuru.com |
| Address: | Box 2589 |
| Garibaldi Highlands, BC Canada | |
| Phone # for sales: | 604-898-9069 |
| Fax: | 604-898-9069 |
| Website: | www.tradesystemguru.com |
| E-mail address: | indextradermb@gmail.com |
Traders' Resource Links | |
| TradeSystemGuru.com has not added any product or service information to TRADERS' RESOURCE. | |
Click here for more information about our publications!
PRINT THIS ARTICLE

Request Information From Our Sponsors
- VectorVest, Inc.
- Executive Premier Workshop
- One-Day Options Course
- OptionsPro
- Retirement Income Workshop
- Sure-Fire Trading Systems (VectorVest, Inc.)
- Trading as a Business Workshop
- VectorVest 7 EOD
- VectorVest 7 RealTime/IntraDay
- VectorVest AutoTester
- VectorVest Educational Services
- VectorVest OnLine
- VectorVest Options Analyzer
- VectorVest ProGraphics v6.0
- VectorVest ProTrader 7
- VectorVest RealTime Derby Tool
- VectorVest Simulator
- VectorVest Variator
- VectorVest Watchdog
- StockCharts.com, Inc.
- Candle Patterns
- Candlestick Charting Explained
- Intermarket Technical Analysis
- John Murphy on Chart Analysis
- John Murphy's Chart Pattern Recognition
- John Murphy's Market Message
- MurphyExplainsMarketAnalysis-Intermarket Analysis
- MurphyExplainsMarketAnalysis-Visual Analysis
- StockCharts.com
- Technical Analysis of the Financial Markets
- The Visual Investor
