HOT TOPICS LIST
- MACD
- Fibonacci
- RSI
- Gann
- ADXR
- Stochastics
- Volume
- Triangles
- Futures
- Cycles
- Volatility
- ZIGZAG
- MESA
- Retracement
- Aroon
INDICATORS LIST
LIST OF TOPICS
PRINT THIS ARTICLE
by James Kupfer
Scott's Miracle-Gro stock is facing a number of technical hurdles and may be in a good place to sell or short.
Position: Sell
James Kupfer
Mr. Kupfer is a market professional and amateur stock market commentator. Disclosure: It is likely that Mr. Kupfer has or will enter a position in any security he writes about.
PRINT THIS ARTICLE
STOCHASTIC OSCILL
Scott's Miracle-Gro Out Of Pep?
11/19/08 12:31:36 PMby James Kupfer
Scott's Miracle-Gro stock is facing a number of technical hurdles and may be in a good place to sell or short.
Position: Sell
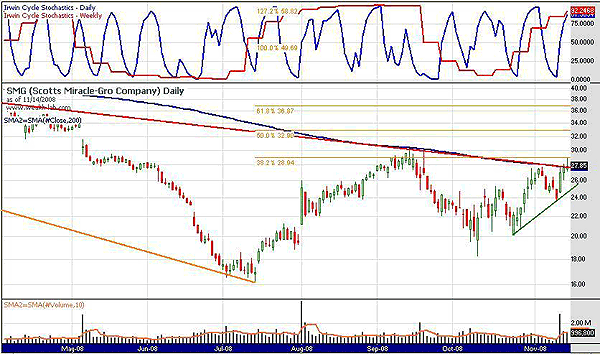
| Scott's Miracle-Gro has dramatically outperformed the broad equity markets in recent months. Now, however, the stock appears to have run into a number of technical roadblocks that may well reverse this trend. None of these technical indicators would necessarily trigger a sell or short of the stock by themselves, but taken together they flash a warning that something does not smell right here. |

|
| FIGURE 1: SMG: DAILY. Note that the daily and weekly stochastics are very overbought (top panel). |
| Graphic provided by: Wealth-lab. |
| |
| First, as shown in the top panel of this daily chart (Figure 1), both the daily and weekly stochastics are very overbought. Second, the stock is right at its 200-day simple moving average (SMA), as shown by the blue line (it can be hard to see under the red line). SMG tried and failed in September to break through this same SMA. Third, at almost the exact level of the 200-day SMA the stock finds resistance from a downward-sloping trendline shown in red that started in November 2007. Finally, the stock is also now at the 38.2% Fibonacci retracement level formed between the August 2007 top and July 2008 bottom. |
| Given the stock's strength relative to the broad markets and its upward progress since October, it is entirely possible that SMG can surpass all these technical signs that its move up is over. However, on balance, the evidence suggests that a prudent strategy would be to sell any long positions or at least implement a close stop below $24. Traders wishing to implement a short here should place a stop north of $30.25 and have an initial exit target of $20. |
Mr. Kupfer is a market professional and amateur stock market commentator. Disclosure: It is likely that Mr. Kupfer has or will enter a position in any security he writes about.
Click here for more information about our publications!
PRINT THIS ARTICLE

Request Information From Our Sponsors
- VectorVest, Inc.
- Executive Premier Workshop
- One-Day Options Course
- OptionsPro
- Retirement Income Workshop
- Sure-Fire Trading Systems (VectorVest, Inc.)
- Trading as a Business Workshop
- VectorVest 7 EOD
- VectorVest 7 RealTime/IntraDay
- VectorVest AutoTester
- VectorVest Educational Services
- VectorVest OnLine
- VectorVest Options Analyzer
- VectorVest ProGraphics v6.0
- VectorVest ProTrader 7
- VectorVest RealTime Derby Tool
- VectorVest Simulator
- VectorVest Variator
- VectorVest Watchdog
- StockCharts.com, Inc.
- Candle Patterns
- Candlestick Charting Explained
- Intermarket Technical Analysis
- John Murphy on Chart Analysis
- John Murphy's Chart Pattern Recognition
- John Murphy's Market Message
- MurphyExplainsMarketAnalysis-Intermarket Analysis
- MurphyExplainsMarketAnalysis-Visual Analysis
- StockCharts.com
- Technical Analysis of the Financial Markets
- The Visual Investor
