HOT TOPICS LIST
- MACD
- Fibonacci
- RSI
- Gann
- ADXR
- Stochastics
- Volume
- Triangles
- Futures
- Cycles
- Volatility
- ZIGZAG
- MESA
- Retracement
- Aroon
INDICATORS LIST
LIST OF TOPICS
PRINT THIS ARTICLE
by Donald W. Pendergast, Jr.
After tracing out a distinct five-wave pattern of reasonable proportion, price-momentum divergences suggest that the British pound may be due for a reversal.
Position: Accumulate
Donald W. Pendergast, Jr.
Donald W. Pendergast is a financial markets consultant who offers specialized services to stock brokers and high net worth individuals who seek a better bottom line for their portfolios.
PRINT THIS ARTICLE
ELLIOTT WAVE
The British Pound: Is The Smart Money Accumulating?
11/19/08 12:17:12 PMby Donald W. Pendergast, Jr.
After tracing out a distinct five-wave pattern of reasonable proportion, price-momentum divergences suggest that the British pound may be due for a reversal.
Position: Accumulate
| The British pound has been in a downtrend against the US dollar since July 2008, having declined by approximately 28% as of early November 2008. It's fallen so hard that it has retraced most of the gains made against the dollar since mid-2001. Why? Mortgage, housing, and a general economic crises has caused the British government to cut interest rates, bail out troubled banks, and institute a policy of even greater deficit spending. Such government actions tend to cause currencies to be sold off in anticipation of future currency devaluation due to inflation concerns. That's certainly the case with the British pound right now, but the charts and Commitments Of Traders (COT) data are suggesting that a reversal may be in the cards for the pound sterling, perhaps sooner than later. |

|
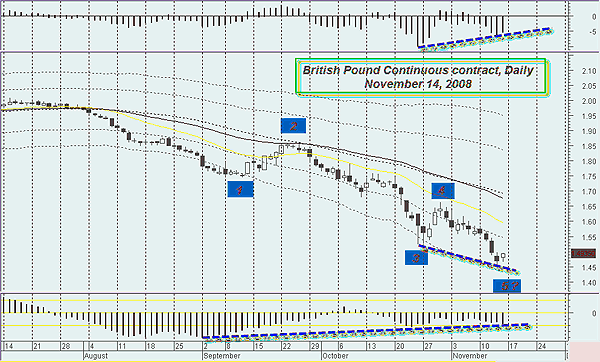
| FIGURE 1: BRITISH POUND, DAILY. Here's a five-wave downtrend: Is it ready to reverse? |
| Graphic provided by: MetaStock. |
| Graphic provided by: Three indicators from ProfitTrader for MetaStock. |
| |
| The daily chart of the pound depicts a beautiful, smooth five-wave downtrend that generally fits standard Elliott wave criteria; wave 4 does not overlap wave 1 and wave 3 is not the shortest wave (Figure 1). Wave 5 hasn't traveled very far, as a major price-momentum divergence has printed on the chart (on both the detrend oscillator [top of chart] and the Chaikin money flow [bottom of chart]). Note how the extreme lower Keltner band has essentially formed the lower boundary at the terminal points of waves 1, 3, and 5. With price pulling away from the Keltner band again, this may signal the start of a consolidating, sideways action phase, similar to what the daily chart of the US dollar is now demonstrating. Recent COT data also suggests that the "smart money" -- that is, commercial interests -- is accumulating the pound. |

|
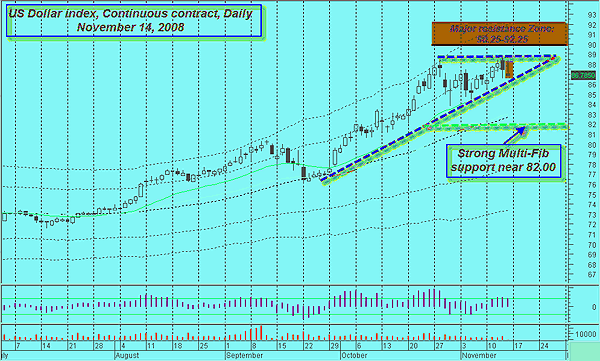
| FIGURE 2: BRITISH POUND, DAILY. Here's strong overhead resistance and a bearish candlestick. |
| Graphic provided by: MetaStock. |
| Graphic provided by: Three indicators from ProfitTrader for MetaStock. |
| |
| Meanwhile, the US dollar has had a great run, most of it undergirded by a combination of heavy short-covering and mass fear, both induced by the unprecedented global financial crisis of the past few months. Large speculators are still heavily long the dollar, according to the COT data; apparently the trend-followers are still expecting the dollar to make further gains, even as the commercial interests are betting on the pound. On the chart, the dollar just printed a long upper shadow, which is a bearish signal near a significant high, more so because it printed after price failed to take out the October high. If a subsequent attempt at the 89.00 area fails, watch and see if the blue uptrend line is broken. If it is broken, expect a swift move down toward major Fibonacci support near 82.00 (Figure 2). If dollar bulls can take out 89.00, they will soon have to contend with major overhead resistance between 90.25-92.25, which includes the November 2005 high and the 38.2% retracement of the entire plunge from 121.29 to 70.81. |
| It's quite a battle, the one now shaping up between the US dollar and the British pound. Overall, the weight of the technical evidence suggests that the dollar will fall and the pound will rise, but only time will tell. The weekly CFTC Commitment of Traders report helps provide currency traders with important fundamental data that can help confirm a thoughtful trader's technical forecast, and anyone who trades commodities, currencies, and stock indexes would do well to learn how to interpret and apply such vital data into their own trading routines. |
Donald W. Pendergast is a financial markets consultant who offers specialized services to stock brokers and high net worth individuals who seek a better bottom line for their portfolios.
| Title: | Writer, market consultant |
| Company: | Linear Trading Systems LLC |
| Jacksonville, FL 32217 | |
| Phone # for sales: | 904-239-9564 |
| E-mail address: | lineartradingsys@gmail.com |
Traders' Resource Links | |
| Linear Trading Systems LLC has not added any product or service information to TRADERS' RESOURCE. | |
Click here for more information about our publications!
Comments

Request Information From Our Sponsors
- StockCharts.com, Inc.
- Candle Patterns
- Candlestick Charting Explained
- Intermarket Technical Analysis
- John Murphy on Chart Analysis
- John Murphy's Chart Pattern Recognition
- John Murphy's Market Message
- MurphyExplainsMarketAnalysis-Intermarket Analysis
- MurphyExplainsMarketAnalysis-Visual Analysis
- StockCharts.com
- Technical Analysis of the Financial Markets
- The Visual Investor
- VectorVest, Inc.
- Executive Premier Workshop
- One-Day Options Course
- OptionsPro
- Retirement Income Workshop
- Sure-Fire Trading Systems (VectorVest, Inc.)
- Trading as a Business Workshop
- VectorVest 7 EOD
- VectorVest 7 RealTime/IntraDay
- VectorVest AutoTester
- VectorVest Educational Services
- VectorVest OnLine
- VectorVest Options Analyzer
- VectorVest ProGraphics v6.0
- VectorVest ProTrader 7
- VectorVest RealTime Derby Tool
- VectorVest Simulator
- VectorVest Variator
- VectorVest Watchdog
