HOT TOPICS LIST
- MACD
- Fibonacci
- RSI
- Gann
- ADXR
- Stochastics
- Volume
- Triangles
- Futures
- Cycles
- Volatility
- ZIGZAG
- MESA
- Retracement
- Aroon
INDICATORS LIST
LIST OF TOPICS
PRINT THIS ARTICLE
by James Kupfer
Gold still appears to be in an intermediate-term position for buying. The channel helps determine the future price target.
Position: Buy
James Kupfer
Mr. Kupfer is a market professional and amateur stock market commentator. Disclosure: It is likely that Mr. Kupfer has or will enter a position in any security he writes about.
PRINT THIS ARTICLE
TREND-CHANNEL
Gold Still Golden
11/18/08 09:16:23 AMby James Kupfer
Gold still appears to be in an intermediate-term position for buying. The channel helps determine the future price target.
Position: Buy
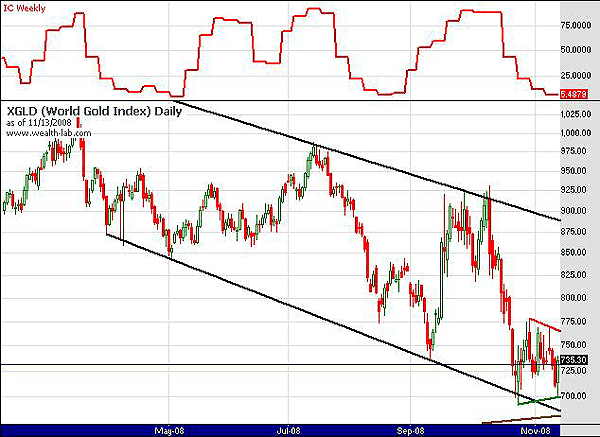
| On October 28, 2008, I wrote that on an intermediate-term basis, "gold is currently at a level of significant support. ... While gold can move lower, like it did last week [to below $691], without breaking the support levels, prices now appear in a favorable position to buy." (See Figure 1.) Since then, not much has changed. Gold has undergone a consolidation period vacillating between the previously reached $691 level up to $777. |

|
| FIGURE 1: $XGLD, DAILY. Gold has undergone a consolidation period vacillating between the previously reached $691 level up to $777. |
| Graphic provided by: Wealth-lab. |
| |
| The technical picture remains mostly the same from my October 28th report. Gold has held the support levels previously provided and has possibly formed an additional short-term trading pattern that provide even further support at the $700 level (shown as the green line on the chart). In addition, the weekly stochastics are deeply oversold. For the intermediate term, gold still looks to be in a position to buy. |
| To Figure 1, I have added an additional trendline showing the potential price target for a move up in gold. Duplicating the bottom black trendline and fitting it to the peaks of gold's prices form the trendline. It would likely take months for prices to make it back to the top of the trendline, but even by the time it does, prices would likely be around $850, if not higher. |
Mr. Kupfer is a market professional and amateur stock market commentator. Disclosure: It is likely that Mr. Kupfer has or will enter a position in any security he writes about.
Click here for more information about our publications!
Comments
Date: 11/25/08Rank: 4Comment:

Request Information From Our Sponsors
- StockCharts.com, Inc.
- Candle Patterns
- Candlestick Charting Explained
- Intermarket Technical Analysis
- John Murphy on Chart Analysis
- John Murphy's Chart Pattern Recognition
- John Murphy's Market Message
- MurphyExplainsMarketAnalysis-Intermarket Analysis
- MurphyExplainsMarketAnalysis-Visual Analysis
- StockCharts.com
- Technical Analysis of the Financial Markets
- The Visual Investor
- VectorVest, Inc.
- Executive Premier Workshop
- One-Day Options Course
- OptionsPro
- Retirement Income Workshop
- Sure-Fire Trading Systems (VectorVest, Inc.)
- Trading as a Business Workshop
- VectorVest 7 EOD
- VectorVest 7 RealTime/IntraDay
- VectorVest AutoTester
- VectorVest Educational Services
- VectorVest OnLine
- VectorVest Options Analyzer
- VectorVest ProGraphics v6.0
- VectorVest ProTrader 7
- VectorVest RealTime Derby Tool
- VectorVest Simulator
- VectorVest Variator
- VectorVest Watchdog
