HOT TOPICS LIST
- MACD
- Fibonacci
- RSI
- Gann
- ADXR
- Stochastics
- Volume
- Triangles
- Futures
- Cycles
- Volatility
- ZIGZAG
- MESA
- Retracement
- Aroon
INDICATORS LIST
LIST OF TOPICS
PRINT THIS ARTICLE
by Mike Carr, CMT
As markets continue to plummet and volatility increases, stocks in tight trading ranges can offer safety and potential upside.
Position: Buy
Mike Carr, CMT
Mike Carr, CMT, is a member of the Market Technicians Association, and editor of the MTA's newsletter, Technically Speaking. He is also the author of "Smarter Investing in Any Economy: The Definitive Guide to Relative Strength Investing," and "Conquering the Divide: How to Use Economic Indicators to Catch Stock Market Trends."
PRINT THIS ARTICLE
STRATEGIES
Finding Buys In A Bear Market
11/18/08 09:11:02 AMby Mike Carr, CMT
As markets continue to plummet and volatility increases, stocks in tight trading ranges can offer safety and potential upside.
Position: Buy
| One problem investors face in a bear market is fear. This emotion is the well-known cause of panic selling, but it also causes traders to look for buying opportunities because they fear being in 100% cash after the bottom occurs. One pattern that could prove useful is a trading range, indicating the stock has avoided most of the downside. Combining this pattern with other indicators can point us in the direction of potential buys. |
| For traders who are capable of ignoring the news, bank stocks can be potential buys. Prosperity Bancshares (PRSP) operates almost 300 branches throughout Texas after acquiring Franklin Bank. Franklin represented the third-largest bank failure this year, and the fact that PRSP was able to buy it shows that regulators have confidence in its fundamentals. |
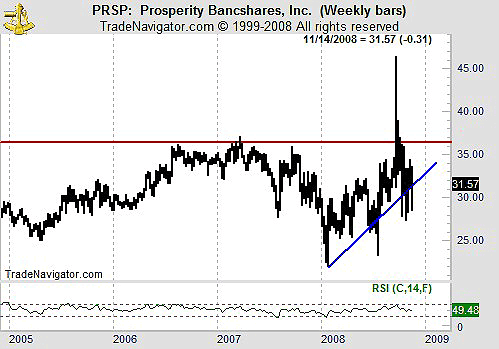
| In Figure 1, we show a weekly chart of PRSP. A 10-point trading range may seem wide, but given the daily market action this year, that is actually lower than average volatility. In fact, the beta of PRSP is only 0.44, indicating it moves less than half as much as the overall market. Low beta stocks should offer downside protection in a bear market. The rising trendline offers support. The resistance at 36 offers a price target. The stop is best set using beta — on a weekly basis, calculate the market loss and if PRSP declined by more than half that amount, the position should be closed on the next open. |

|
| FIGURE 1: PRSP, WEEKLY. The rising trendline is drawn using only closing prices on this chart. Given recent volatility, we should get a clearer measure of the trend with this technique, which ignores the intraday panic lows. |
| Graphic provided by: Trade Navigator. |
| |
| Figure 1 also shows that the relative strength index (RSI) has remained above 40 for most of this year. Analyst Andrew Cardwell studied this indicator extensively, and identified the concept of RSI range rules. He observed that in uptrends, the RSI will usually stay between values of 40 to 80 and in bear markets, the indicator will typically fall to 20 and stay below 60. When price is rangebound, as it is with PRSP, the RSI tends to oscillate between 40 and 60 before breaking out into a higher or lower range. A breakout in the RSI can be used to time entry into this trade, for risk-averse traders. |
| Additional bullish support is found in the large short interest in PRSP. Buyins.net reports that more than 10% of the float has been shorted, creating a lot of potential demand. The squeeze trigger represents the average price level where short positions were initiated. At this level, many shorts are likely to cover their trade and find a more profitable opportunity in the market. Buyins.net calculates that the average short is losing money after factoring in the dividend, which they must cover since the squeeze trigger is 31.73. PRSP should be considered to be a buy candidate in this bear market environment. |
Mike Carr, CMT, is a member of the Market Technicians Association, and editor of the MTA's newsletter, Technically Speaking. He is also the author of "Smarter Investing in Any Economy: The Definitive Guide to Relative Strength Investing," and "Conquering the Divide: How to Use Economic Indicators to Catch Stock Market Trends."
| Website: | www.moneynews.com/blogs/MichaelCarr/id-73 |
| E-mail address: | marketstrategist@gmail.com |
Click here for more information about our publications!
Comments

Request Information From Our Sponsors
- StockCharts.com, Inc.
- Candle Patterns
- Candlestick Charting Explained
- Intermarket Technical Analysis
- John Murphy on Chart Analysis
- John Murphy's Chart Pattern Recognition
- John Murphy's Market Message
- MurphyExplainsMarketAnalysis-Intermarket Analysis
- MurphyExplainsMarketAnalysis-Visual Analysis
- StockCharts.com
- Technical Analysis of the Financial Markets
- The Visual Investor
- VectorVest, Inc.
- Executive Premier Workshop
- One-Day Options Course
- OptionsPro
- Retirement Income Workshop
- Sure-Fire Trading Systems (VectorVest, Inc.)
- Trading as a Business Workshop
- VectorVest 7 EOD
- VectorVest 7 RealTime/IntraDay
- VectorVest AutoTester
- VectorVest Educational Services
- VectorVest OnLine
- VectorVest Options Analyzer
- VectorVest ProGraphics v6.0
- VectorVest ProTrader 7
- VectorVest RealTime Derby Tool
- VectorVest Simulator
- VectorVest Variator
- VectorVest Watchdog
