HOT TOPICS LIST
- MACD
- Fibonacci
- RSI
- Gann
- ADXR
- Stochastics
- Volume
- Triangles
- Futures
- Cycles
- Volatility
- ZIGZAG
- MESA
- Retracement
- Aroon
INDICATORS LIST
LIST OF TOPICS
PRINT THIS ARTICLE
by Arthur Hill
Travelers is bucking the trend in financials by holding well above its October lows, and a consolidation breakout would open the door to higher prices.
Position: Accumulate
Arthur Hill
Arthur Hill is currently editor of TDTrader.com, a website specializing in trading strategies, sector/industry specific breadth stats and overall technical analysis. He passed the Society of Technical Analysts (STA London) diploma exam with distinction is a Certified Financial Technician (CFTe). Prior to TD Trader, he was the Chief Technical Analyst for Stockcharts.com and the main contributor to the ChartSchool.
PRINT THIS ARTICLE
FLAGS AND PENNANTS
Travelers Travels Higher
11/18/08 09:04:10 AMby Arthur Hill
Travelers is bucking the trend in financials by holding well above its October lows, and a consolidation breakout would open the door to higher prices.
Position: Accumulate
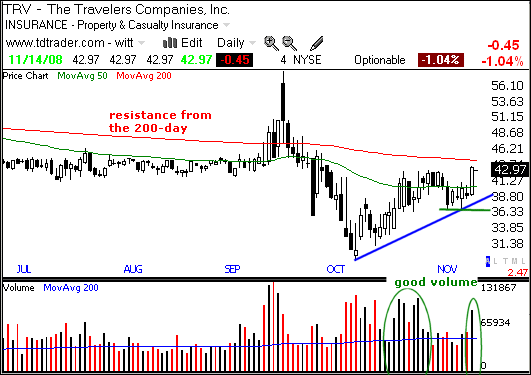
| Figure 1 shows daily candlesticks for Travelers Companies (TRV). The stock declined sharply with the rest of the market and then bottomed in early October. While the Standard & Poor's 500 and the financial sector tested their early October lows over the last few weeks, TRV moved higher and then held well above these lows. This shows relative strength versus the overall market and the sector. |

|
| FIGURE 1: TRV, DAILY. The stock declined sharply with the rest of the market and then bottomed in early October. |
| Graphic provided by: TeleChart2007. |
| |
| Despite overhead resistance, the trend since early October is up and volume shows underlying strength. There is resistance in the low 40s from the 200-day moving average. However, the black volume bars show strong buying pressure over the last few weeks, and this underpins the advance. Recently, the stock surged back above 40 to establish support around 37. This level holds the key to the current uptrend. |

|
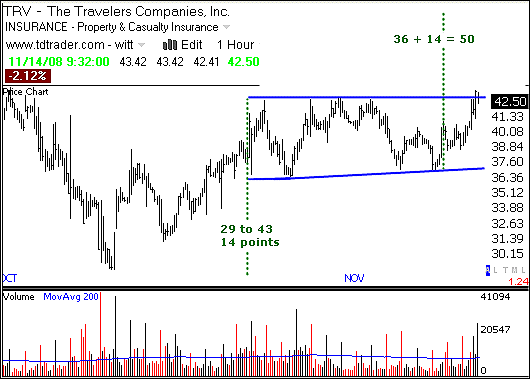
| FIGURE 2: TRV, HOURLY. This stock sported a sharp advance and then a consolidation. |
| Graphic provided by: TeleChart2007. |
| |
| Figure 2 shows 60-minute bars over the last seven weeks. TRV sports a sharp advance and then a consolidation. This looks like a flag flying at half-mast. The green dotted line forms the flagpole and the blue lines form the flag. Flags are continuation patterns based on the prior move, which was up in this case. A break above flag resistance would project further strength toward 50. |
Arthur Hill is currently editor of TDTrader.com, a website specializing in trading strategies, sector/industry specific breadth stats and overall technical analysis. He passed the Society of Technical Analysts (STA London) diploma exam with distinction is a Certified Financial Technician (CFTe). Prior to TD Trader, he was the Chief Technical Analyst for Stockcharts.com and the main contributor to the ChartSchool.
| Title: | Editor |
| Company: | TDTrader.com |
| Address: | Willem Geetsstraat 17 |
| Mechelen, B2800 | |
| Phone # for sales: | 3215345465 |
| Website: | www.tdtrader.com |
| E-mail address: | arthurh@tdtrader.com |
Traders' Resource Links | |
| TDTrader.com has not added any product or service information to TRADERS' RESOURCE. | |
Click here for more information about our publications!
PRINT THIS ARTICLE

Request Information From Our Sponsors
- VectorVest, Inc.
- Executive Premier Workshop
- One-Day Options Course
- OptionsPro
- Retirement Income Workshop
- Sure-Fire Trading Systems (VectorVest, Inc.)
- Trading as a Business Workshop
- VectorVest 7 EOD
- VectorVest 7 RealTime/IntraDay
- VectorVest AutoTester
- VectorVest Educational Services
- VectorVest OnLine
- VectorVest Options Analyzer
- VectorVest ProGraphics v6.0
- VectorVest ProTrader 7
- VectorVest RealTime Derby Tool
- VectorVest Simulator
- VectorVest Variator
- VectorVest Watchdog
- StockCharts.com, Inc.
- Candle Patterns
- Candlestick Charting Explained
- Intermarket Technical Analysis
- John Murphy on Chart Analysis
- John Murphy's Chart Pattern Recognition
- John Murphy's Market Message
- MurphyExplainsMarketAnalysis-Intermarket Analysis
- MurphyExplainsMarketAnalysis-Visual Analysis
- StockCharts.com
- Technical Analysis of the Financial Markets
- The Visual Investor
