

HOT TOPICS LIST
- MACD
- Fibonacci
- RSI
- Gann
- ADXR
- Stochastics
- Volume
- Triangles
- Futures
- Cycles
- Volatility
- ZIGZAG
- MESA
- Retracement
- Aroon
INDICATORS LIST
LIST OF TOPICS
PRINT THIS ARTICLE
by Alan R. Northam
SSRI is bouncing off a long-term support zone and is entering into a corrective rally that could see silver move up to $21.00 per ounce before the selloff resumes.
Position: N/A
Alan R. Northam
Alan Northam lives in the Dallas, Texas area and as an electronic engineer gave him an analytical mind from which he has developed a thorough knowledge of stock market technical analysis. His abilities to analyze the future direction of the stock market has allowed him to successfully trade of his own portfolio over the last 30 years. Mr. Northam is now retired and trading the stock market full time. You can reach him at inquiry@tradersclassroom.com or by visiting his website at http://www.tradersclassroom.com. You can also follow him on Twitter @TradersClassrm.
PRINT THIS ARTICLE
TREND-CHANNEL
Silver Standard Resources Bouncing Off Support
11/18/08 08:44:06 AMby Alan R. Northam
SSRI is bouncing off a long-term support zone and is entering into a corrective rally that could see silver move up to $21.00 per ounce before the selloff resumes.
Position: N/A
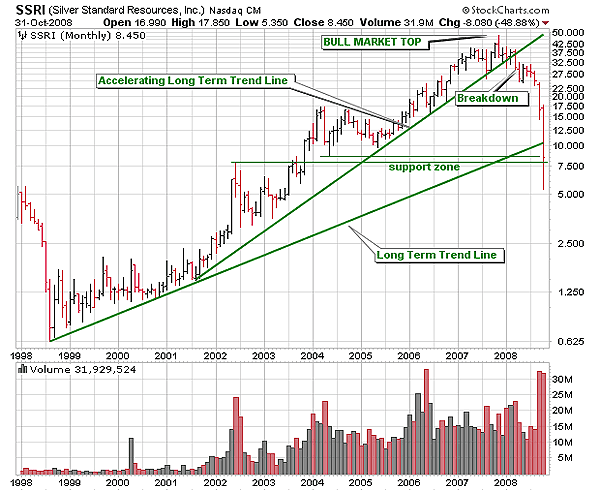
| Silver Standard Resources (SSRI) has been in a long-term bull market since 1998. Figure 1 shows two long-term trendlines drawn on the monthly chart. The more shallow long-term trendline is the original trendline drawn off the first reaction low set in 2000. From 2000 forward, SSRI accelerated and formed a steeper long-term trendline. This steeper trendline remained in place for six years without being penetrated, making it a strong line of support. However, early in 2008 this support line was broken when SSRI broke down below it. The breakdown of this trendline has signaled the end of the acceleration period of higher prices for SSRI. Since the breakdown, SSRI has continued to trade lower and has more recently broken below the shallow long-term trendline, signaling that the long-term trend is either now in jeopardy or has come to an end. SSRI has also broken below the support zone drawn off the late 2002 peak and the mid- to late 2004 trough but managed to close the month well off the low and back within the support zone. This could be considered a false breakdown and a sign that the support zone is holding. Note that during the last two months the volume bars are quite high. This is a sign of a selling climax and could be signaling that this market is ready for a rebound. |
|
| FIGURE 1: SSRI, MONTHLY. This chart shows long-term trendlines and support. This chart also shows that SSRI has broken down below the long-term trendline and has found support at around 7.500. |
| Graphic provided by: StockCharts.com. |
| |
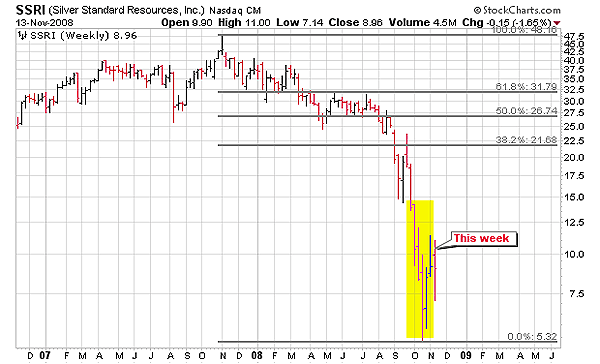
| Figure 2 shows the weekly price chart of SSRI. This chart shows that SSRI has formed a reversal point four weeks ago, signaling a short-term trend reversal. A trend reversal occurs when a market low occurs and two bars on both sides make higher lows. An even stronger reversal point occurs when these two bars form higher lows and higher highs, as is the case with SSRI (see yellow highlighted area). Figure 2 also shows the Fibonacci retracement levels. These retracement levels are typical areas for market retracements and, with SSRI having reversed course, offer typical price targets for the completion of a short-term rally before the primary trend resumes. A rally above the 61.8% retracement level signals a high probability that the market will continue higher and will not turn back downward. The last bar on the chart is this week's bar, which is not complete yet. Therefore, it is too early to comment on its influence to the short-term trend reversal. |
|
| FIGURE 2: SSRI, WEEKLY. The yellow highlighted area on this chart shows that SSRI made a market reversal four weeks ago. This chart also shows the Fibonacci retracement levels that are high-probability price targets for the completion of a market corrective rally. |
| Graphic provided by: StockCharts.com. |
| |
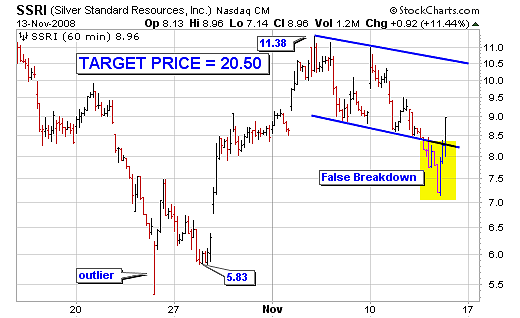
| Figure 3 is that of the 60-minute price chart of SSRI. This chart shows the detail of the trading activity since the October low. Note that I have marked the October low as 5.83 and identified the previous October low as an outlier. An outlier is a price bar that falls outside the normal trading range of the price bars surrounding it. It can be argued as to whether this price bar is in reality an outlier, but the end result is not worth the effort. Since the October low, SSRI has traded upward and is now forming a flag pattern. A flag pattern is a period of consolidation and signals the continuation of the upward trend. Flag patterns are also known to fly at half mast. Therefore, we can take the high of 11.38 and subtract the low of 5.83 from it and then add this difference to the breakout price of the flag, which should occur around 10.50. This then gives a target price for the completion of the upward market correction to be at 20.50. Note that 20.50 is also close to the 38.2% Fibonacci retracement level shown in Figure 2. Therefore, this cluster of price targets forms a strong area of resistance that could turn SSRI back downward. In addition, note that had I used the price minimum of the outlier in the calculation of the price target, it would have made the price target somewhat higher. Therefore, eliminating this bar as a possible outlier makes the price target easier to attain. |
|
| FIGURE 3: SSRI, HOURLY. This chart shows that SSRI is currently trading upward in a market corrective rally. This chart also shows that SSRI is currently forming a flag pattern and is signaling the continuation of the upward corrective rally. |
| Graphic provided by: StockCharts.com. |
| |
| In conclusion, SSRI has broken down below the long-term trendline, bringing to an end an upward trend that had been in existence since 1998. SSRI also appears to have found at least some short-term support at the 2002 price peak and the 2004 price trough. SSRI has also formed a short-term reversal signal suggesting that it has been oversold. Since that time, SSRI has been trading upward in a short-term market corrective rally and is currently forming a flag formation. Using the flag formation and the Fibonacci retracements, a price target range has been determined of 20.50–21.68 for the completion of the current market correction. |
Alan Northam lives in the Dallas, Texas area and as an electronic engineer gave him an analytical mind from which he has developed a thorough knowledge of stock market technical analysis. His abilities to analyze the future direction of the stock market has allowed him to successfully trade of his own portfolio over the last 30 years. Mr. Northam is now retired and trading the stock market full time. You can reach him at inquiry@tradersclassroom.com or by visiting his website at http://www.tradersclassroom.com. You can also follow him on Twitter @TradersClassrm.
| Garland, Tx | |
| Website: | www.tradersclassroom.com |
| E-mail address: | inquiry@tradersclassroom.com |
Click here for more information about our publications!
PRINT THIS ARTICLE

Request Information From Our Sponsors
- StockCharts.com, Inc.
- Candle Patterns
- Candlestick Charting Explained
- Intermarket Technical Analysis
- John Murphy on Chart Analysis
- John Murphy's Chart Pattern Recognition
- John Murphy's Market Message
- MurphyExplainsMarketAnalysis-Intermarket Analysis
- MurphyExplainsMarketAnalysis-Visual Analysis
- StockCharts.com
- Technical Analysis of the Financial Markets
- The Visual Investor
- VectorVest, Inc.
- Executive Premier Workshop
- One-Day Options Course
- OptionsPro
- Retirement Income Workshop
- Sure-Fire Trading Systems (VectorVest, Inc.)
- Trading as a Business Workshop
- VectorVest 7 EOD
- VectorVest 7 RealTime/IntraDay
- VectorVest AutoTester
- VectorVest Educational Services
- VectorVest OnLine
- VectorVest Options Analyzer
- VectorVest ProGraphics v6.0
- VectorVest ProTrader 7
- VectorVest RealTime Derby Tool
- VectorVest Simulator
- VectorVest Variator
- VectorVest Watchdog