

HOT TOPICS LIST
- MACD
- Fibonacci
- RSI
- Gann
- ADXR
- Stochastics
- Volume
- Triangles
- Futures
- Cycles
- Volatility
- ZIGZAG
- MESA
- Retracement
- Aroon
INDICATORS LIST
LIST OF TOPICS
PRINT THIS ARTICLE
by Chaitali Mohile
After the descending triangle breakout, the Computer Technology Index is undergoing bearish consolidation.
Position: Sell
Chaitali Mohile
Active trader in the Indian stock markets since 2003 and a full-time writer. Trading is largely based upon technical analysis.
PRINT THIS ARTICLE
BREAKOUTS
The Computer Technology Index Still Bearish
11/17/08 01:17:08 PMby Chaitali Mohile
After the descending triangle breakout, the Computer Technology Index is undergoing bearish consolidation.
Position: Sell
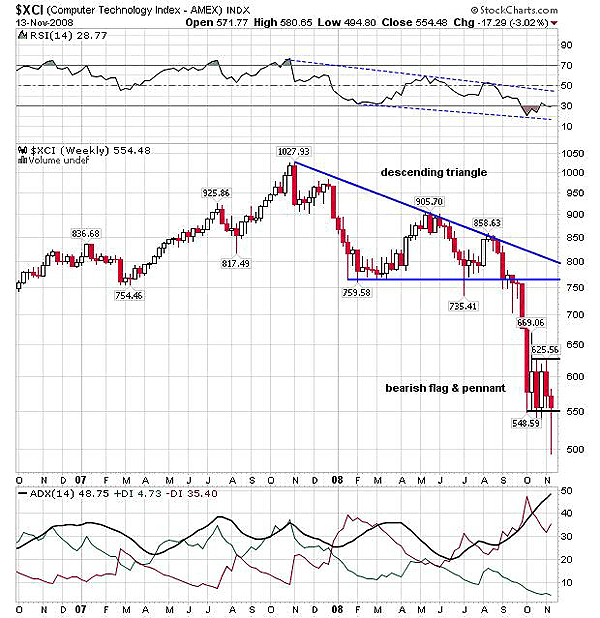
| The Computer Technology Index ($XCI) formed a significant descending triangle on the weekly chart (Figure 1). The uptrend of the index reversed with the first lower high at 980 formed by a doji star, constructing a bearish candlestick pattern of an evening doji star. The index dropped 200 points lower, and thereafter, the series of lower highs with a stable bottom began to form. We know that the descending triangle is a continuation pattern in an existing downtrend, and a reversal pattern if the pattern occurs in an uptrend. In this case, we see the pattern as a continuation pattern, as the index was already in a downtrend during the formation process. During the breakout, the bearish pressure was robust in the existing downtrend. After the breakout, $XCI plunged 200 points from the breakout levels at 750, within two weeks. |
|
| FIGURE 1: $XCI, WEEKLY. The index is consolidating after the bearish breakout of a descending triangle pattern. The breakout of a bearish flag & pennant pattern formed due to consolidation, dragging $XCI to lower lows. |
| Graphic provided by: StockCharts.com. |
| |
| If we measure the potential target on the descending triangle, it would be 1028 - 760 = 268 (length of the triangle), 760 (breakout level) - 268 = 492. But as we can see in Figure 1, $XCI consolidated at the 550 level, much above the breakout target. The index might have entered the consolidation due to the highly oversold relative strength index (RSI) (14). The RSI (14) recovered marginally within the oversold area as the index consolidated. In addition, the average directional movement index (ADX) (14) was overheated (see Figure 1). The consolidation formed another bearish continuation pattern -- the bearish flag & pennant. |
| Therefore, after the breakout of lower consolidation level of 550, $XCI would retrace lower. Initially, we would see first support at 492 levels (descending triangle target), and later, the bearish flag & pennant estimated level should be calculated. Recently, $XCI has reached the descending triangle target. But the indicators are bearish, so the breakout of the bearish flag is under way. The minimum estimated level on this breakout is 200 (flagpole size) - 550 (breakout level) = 350. |
| I would recommend that traders enter a short trade only after the confirmed breakout of the pattern. $XCI remains bearish as the downward rally is under way. |
Active trader in the Indian stock markets since 2003 and a full-time writer. Trading is largely based upon technical analysis.
| Company: | Independent |
| Address: | C1/3 Parth Indraprasth Towers. Vastrapur |
| Ahmedabad, Guj 380015 | |
| E-mail address: | chaitalimohile@yahoo.co.in |
Traders' Resource Links | |
| Independent has not added any product or service information to TRADERS' RESOURCE. | |
Click here for more information about our publications!
Comments
Date:�11/17/08Rank:�4Comment:�

Request Information From Our Sponsors
- StockCharts.com, Inc.
- Candle Patterns
- Candlestick Charting Explained
- Intermarket Technical Analysis
- John Murphy on Chart Analysis
- John Murphy's Chart Pattern Recognition
- John Murphy's Market Message
- MurphyExplainsMarketAnalysis-Intermarket Analysis
- MurphyExplainsMarketAnalysis-Visual Analysis
- StockCharts.com
- Technical Analysis of the Financial Markets
- The Visual Investor
- VectorVest, Inc.
- Executive Premier Workshop
- One-Day Options Course
- OptionsPro
- Retirement Income Workshop
- Sure-Fire Trading Systems (VectorVest, Inc.)
- Trading as a Business Workshop
- VectorVest 7 EOD
- VectorVest 7 RealTime/IntraDay
- VectorVest AutoTester
- VectorVest Educational Services
- VectorVest OnLine
- VectorVest Options Analyzer
- VectorVest ProGraphics v6.0
- VectorVest ProTrader 7
- VectorVest RealTime Derby Tool
- VectorVest Simulator
- VectorVest Variator
- VectorVest Watchdog